Creating Custom Shape Files in R using the SF Package
This post covers two scenarios:
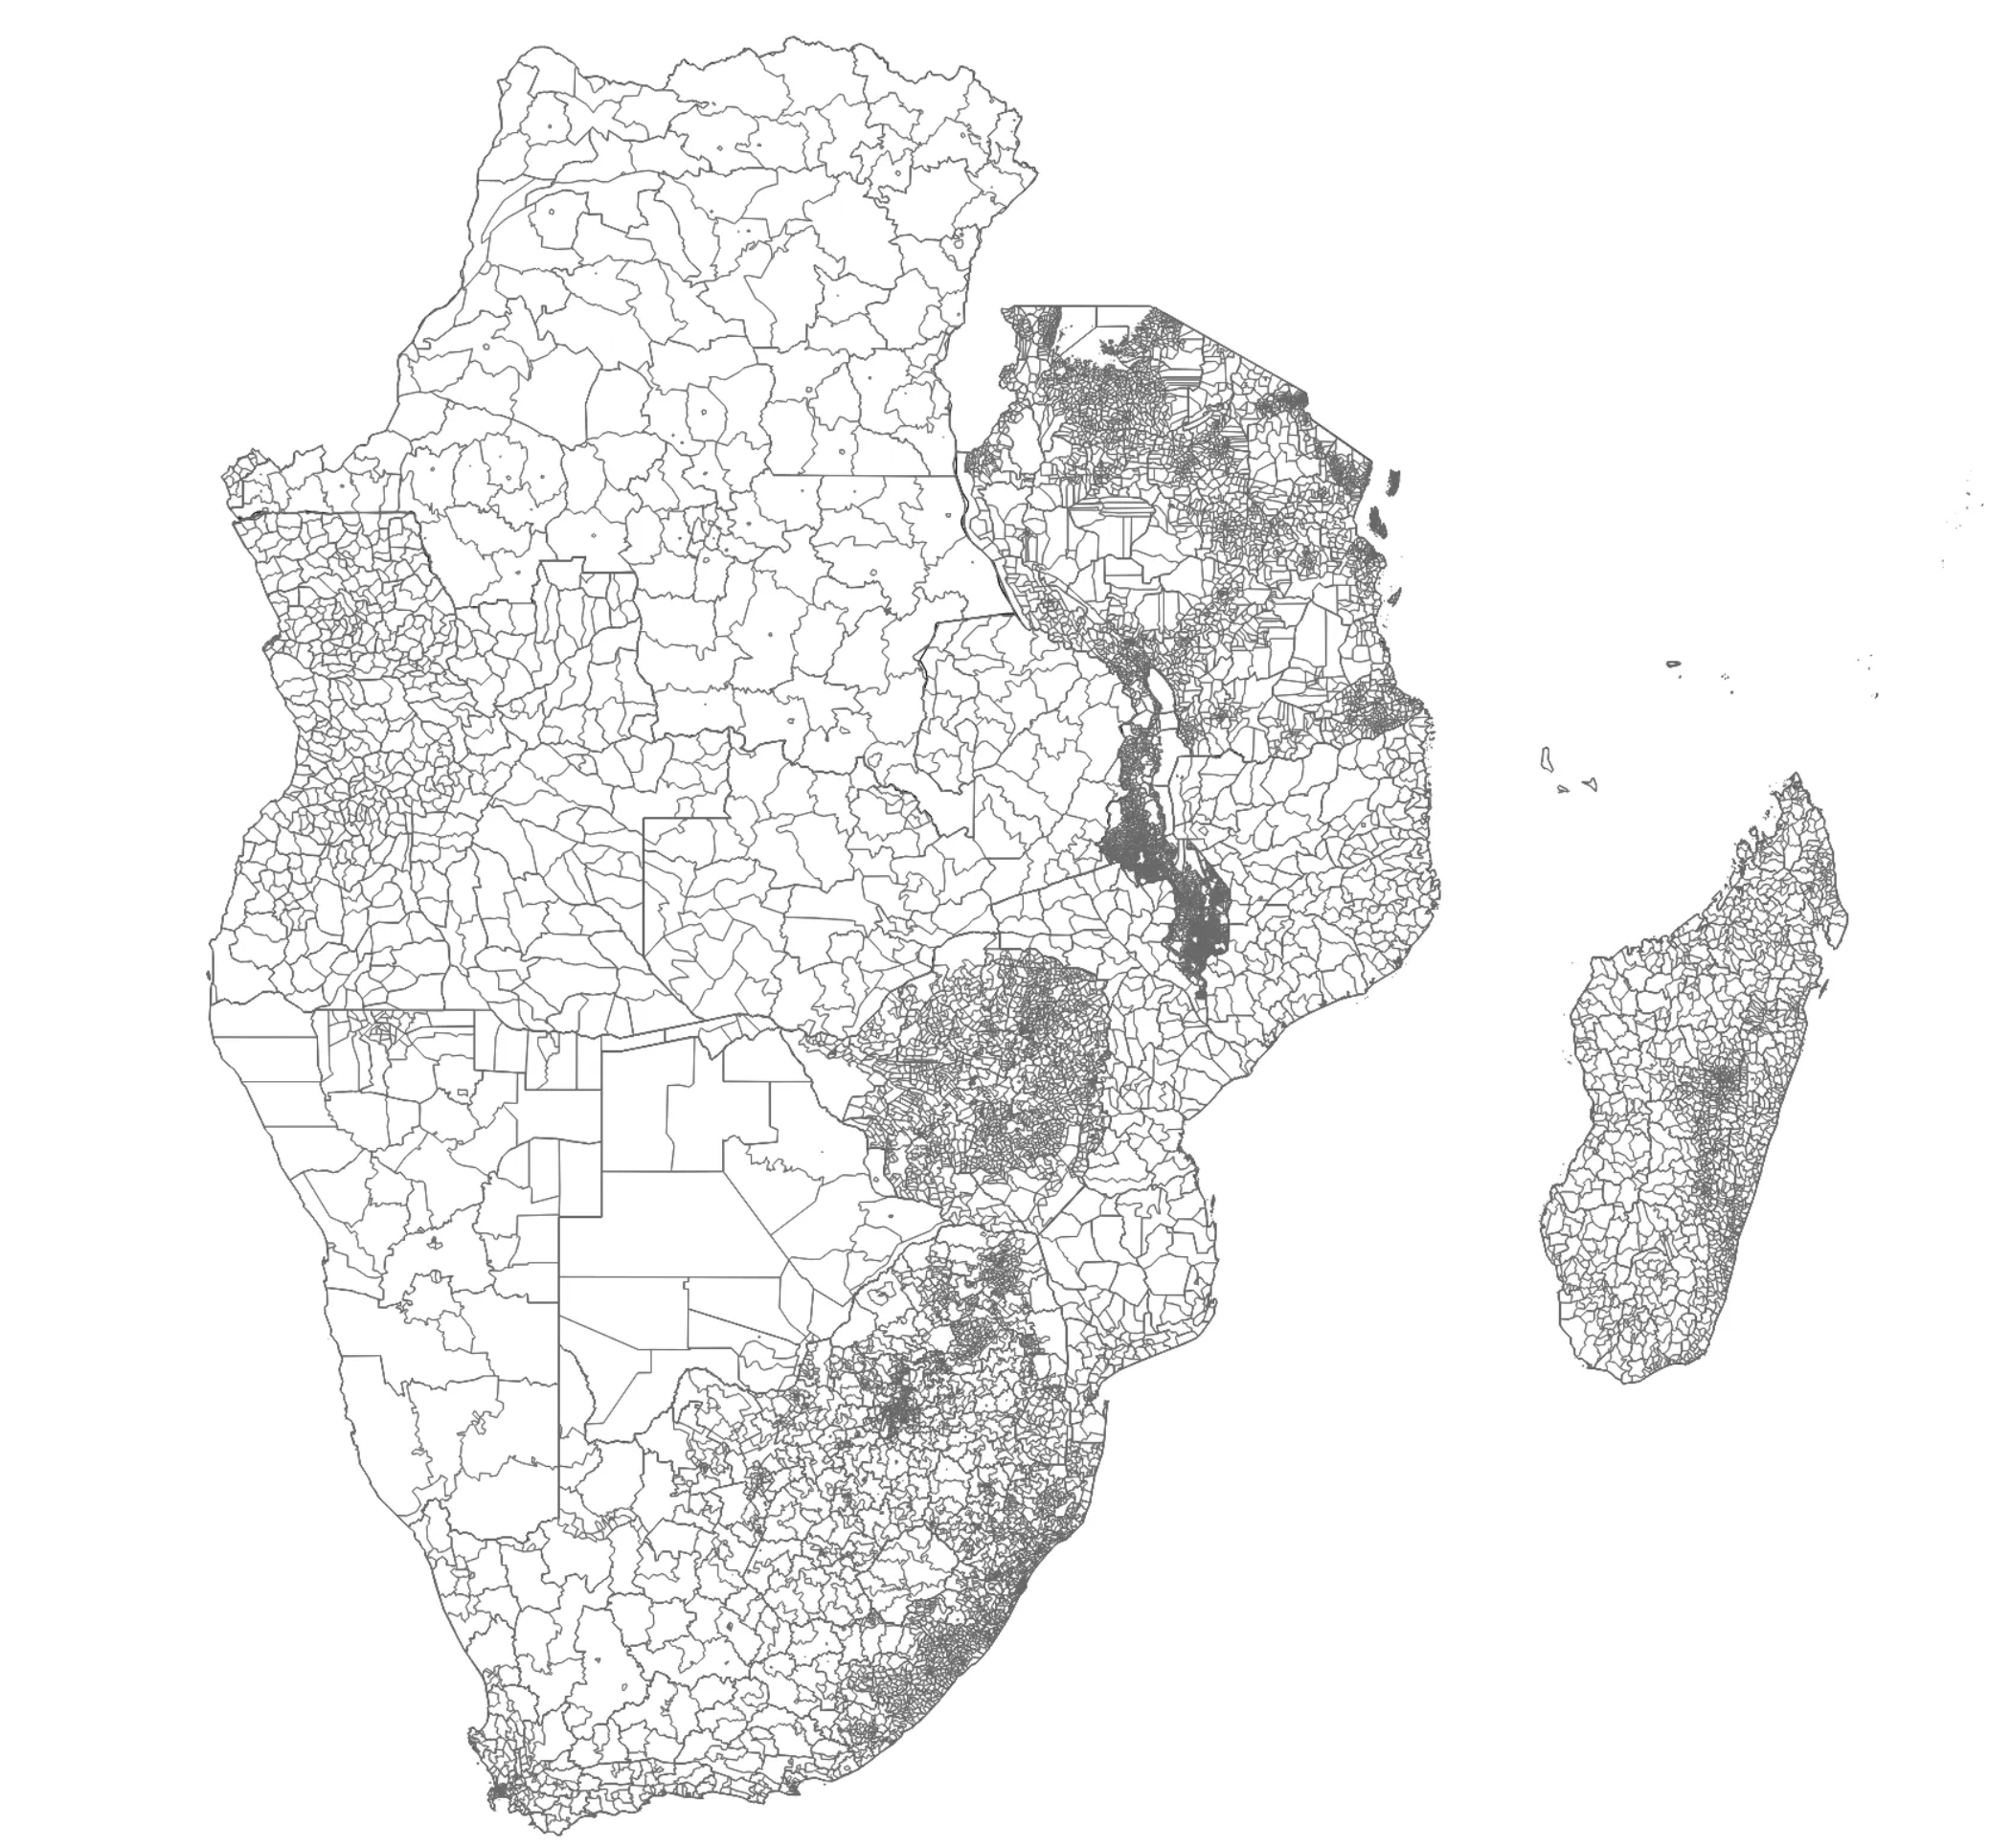
Creating a custom shape file by merging other shape files. For example, if you have multiple shapefiles representing different regions or administrative divisions and you want to merge them into a single shapefile representing the entire area. The example below merges 16 shape files to create the SADC region in Africa.
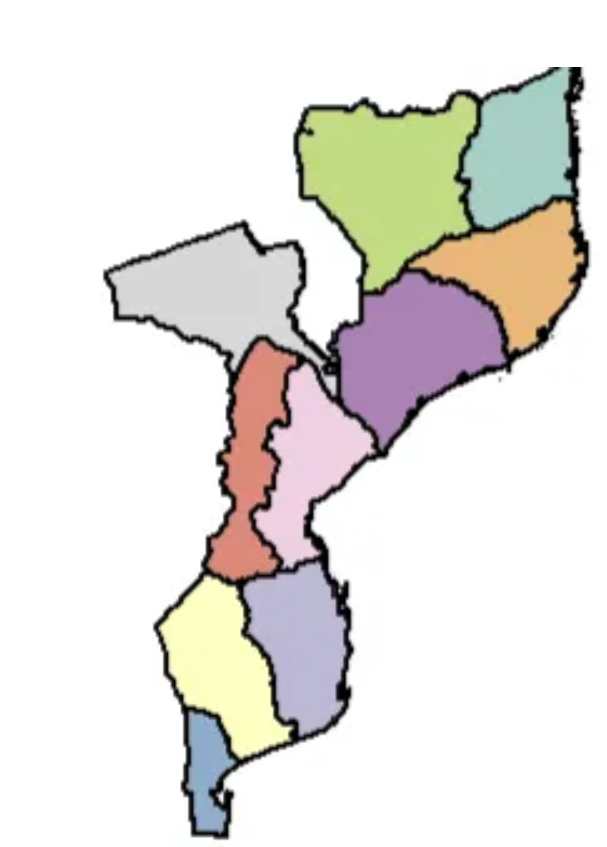
Create a custom shape file merging polygons within the same shape file. If you have a shapefile representing a region, and you want to merge polygons within the same shapefile based on a common attribute, such as administrative divisions. The example below merges a province and a municipality in Mozambique.
1. Generate a tailored shapefile for a particular area using country-level shapefiles.
In this example I have a dataset for the South African Development Community (SADC) and I want to display it on a map. I have shape files for the 16 members, and I want to create one shape file that includes all member states so I can merge the spatial data with my dataset. All shape files are downloaded from gadm.org.
Start by importing libraries and setting up paths.
library(tidyverse)
library(sf)

INPUT_PATH <- "Data_public/"
OUTPUT_PATH <- "Dataout/temp/"
In this example, zip files were downloaded from GADM, so the next step is to unzip the files and put them in the OUTPUT_PATH.
zip_files <- list.files(INPUT_PATH, pattern = "\\.zip$", full.names = TRUE) %>%
    map(unzip, exdir = OUTPUT_PATH)
Next read in all files with the extension .shp and merge them using the SF package. The countries have different levels of granularity, but this is not an issue when using the bind_rows function.
#Read in all .shp files and merge

shapefiles <- list.files(OUTPUT_PATH, pattern = "\\.shp$", full.names = TRUE)
sf_list <- map(shapefiles, st_read)

# Merge the sf objects into a single sf object
merged_sf <- bind_rows(sf_list)
Finally write the new merged shape file, and plot to check all countries are included.
st_write(merged_sf, dsn = "Dataout/merged_SADC.shp")
plot(merged_sf)
The end result is a shape file that includes all levels for all countries in the SADC region.

2. Create a customised shapefile by merging elements
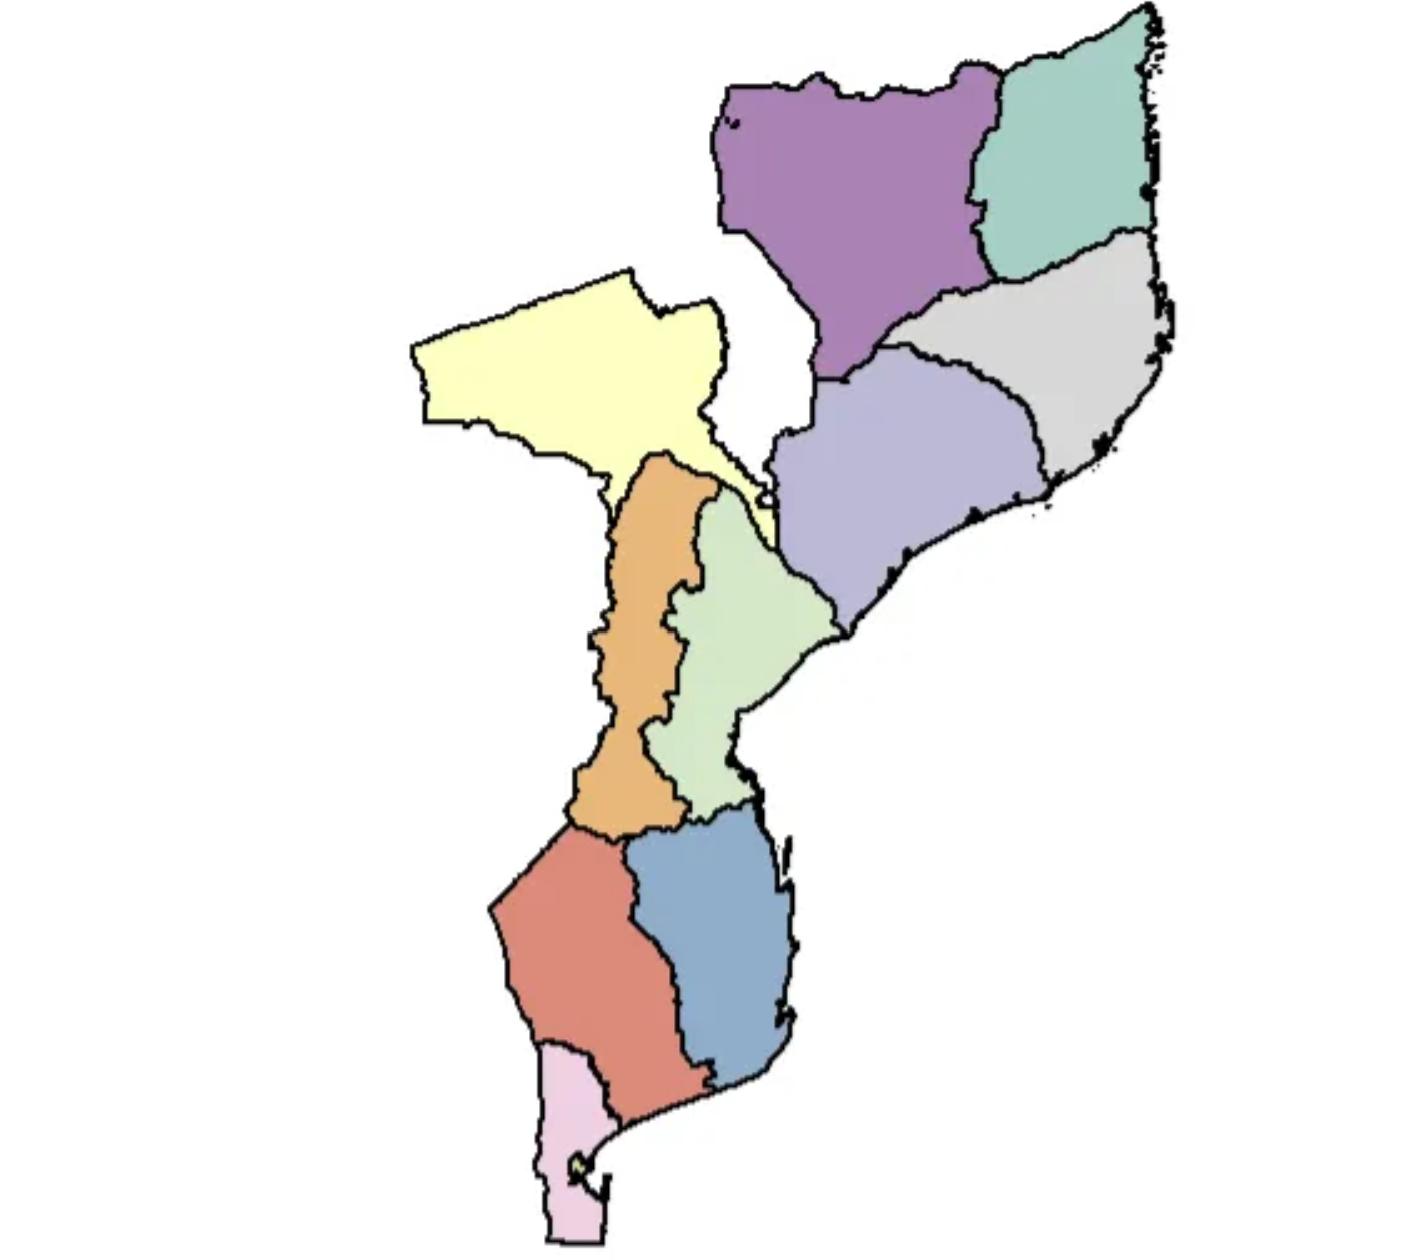
The task is to merge a province and a municipality in Mozambique, specifically Maputo and Maputo City (also known as Cidade de Maputo). Currently, these administrative divisions are stored separately in a shapefile. However, the analysis requires the province/municipality to be merged.

The original dataset has Maputo and Maputo City as two separate provinces in Mozambique. The data is downloaded from gadm.org.

First load the necessary libraries, creating paths and update based on country and what should be merged.
library(sf)
library(janitor)
library(tidyverse)

MOZ_EXAMPLE <- "Data/Moz/gadm41_MOZ_1.shp"
PROVINCES_TO_MERGE <- c("Maputo", "Maputo City")
NAME <-  "Maputo"
COUNTRY <- "Mozambique"
GID_0 <- "MOZ"
OUTPUT <- "Dataout/merged_province/"
The merge_province function consolidates the provinces by merging them, generating the geometry for the resulting merged province, and eliminating the provinces that have been merged to prevent them from appearing as separate entities. Subsequently, it merges the newly created “province” with the existing provinces.
merge_province <- function(province_df, provinces, name, country, gid_0){
temp <- province_df %>%
    filter(name_1 %in% provinces) %>%
        sf::st_union()   #combines the provinces

#creates a spatial object and adds geometry

temp <- sf::st_sf(name_1 = name, geometry = temp) %>%
    mutate(country = COUNTRY,
        gid_0 = GID_0)

#removes the provinces that have been merged
old_province <- province_df %>%
    filter(!name_1 %in% provinces)

#combines the old provinces with the merged province
temp <- bind_rows(old_province, temp)

return(temp)
}
Read in the original shape file, converting it to an SF object, and then plot (using sf) to check all provinces are included.
# Read in the shapefile containing the provinces of Mozambique

original_provinces <- st_read(MOZ_EXAMPLE) %>%
    sf::st_sf() %>%

    #creates a SF object
    clean_names()

plot(original_provinces)
Use the newly created function to merge the desired provinces and create a new shape file. Plot the results using sf.
new_provinces <- original_provinces %>%
    merge_province(PROVINCES_TO_MERGE, NAME, COUNTRY, GID_0)

#show merged provinces
plot(new_provinces)
Finally write the shape file as a spatial file for future use.
# write all spatial files

sf::write_sf(new_provinces, paste0(OUTPUT,"merged_province.shp"))
sf::st_write(new_provinces, paste0(OUTPUT,"merged_province.gpkg"))
sf::st_write(new_provinces, paste0(OUTPUT,"merged_province.geojson"))
The new dataset looks like this:

When plotted in RStudio, all provinces are displayed and Maputo and Maputo City have been merged.

Other links
Identifying Districts Using Coordinates with R’s SF Package
Replicating the HIV Sub-National Estimates Viewer in Tableau: A Step-by-Step Guide (how to create maps in Tableau)