Connect To World Bank DataBank Using R

The World Bank DataBank provides access to open and free global development data. As of February 2023, there are 20152 indicators available for 299 regions/countries for 55 sources with data going back decades.
Thanks to Jesse Pilburn it it easy to access this large dataset by using his wbstats package in R. This article walks through how to use this package to download indicators.
First, let’s install the wbstats package from GitHub:
remotes::install_github("nset-ornl/wbstats")Next load the libraries. The goal is to extract the data needed for further analysis in Tableau.
library(tidyverse)
library(wbstats)
Create global variables. This involves setting the countries of interest, indicators and years. The Armchair TB project is interested in 11 indicators from the SADC, EAC and ECOWAS regions in Africa from 2000–2023.
## Global Variables ----
SADC <- c("COD", "AGO", "NAM", "ZAF", "LSO", "SWZ",
                                 "BWA", "ZWE", "ZMB", "MOZ", "MWI",
                                 "MDG", "COM", "SYC", "MUS")

EAC <- c("BDI", "COG", "KEN", "RWA", "SSD", "TZA", "UGA")

ECOWAS  <- c("BEN", "BFA", "CPV", "CIV", "GMB", "GHA", "GIN",
            "GNB", "LBR", "MLI", "NER", "NGA", "SEN", "SLE", "TGO")


ALL_REGIONS <- c(SADC, EAC, ECOWAS)


START_YEAR = 2000
END_YEAR = 2023

INDICATORS <- c("SH.TBS.INCD", "SH.TBS.DTEC.ZS", "SH.TBS.MORT",
                "SH.TBS.CURE.ZS", "SH.XPD.EHEX.CH.ZS", "SH.XPD.GHED.GE.ZS",
                "SH.UHC.SRVS.CV.XD", "SP.DYN.LE00.FE.IN", "SP.DYN.LE00.MA.IN",
                "HD.HCI.OVRL", "SH.IMM.IBCG")
Use the following to review which indicators and countries are available, as well as find the correct ids.
#all indicators available
all_indicators <- wbstats::wb_indicators()

#all countries available
all_countries <- wbstats::wb_countries()
To search for specific keywords in the indicator list, in this case any indicator that has “tuberculosis” in the name, and then create a list of all IDs, us this:
TB_indicators <- wb_search("Tuberculosis") %>%
    select(indicator_id) %>%
    pull()
Store the meta-data for each indicator so it can be joined to the dataset later.
## Meta-data ----
indicators_metadata <- wbstats::wb_indicators() %>%
    select(indicator_id, indicator, indicator_desc, source_org)
Now to retrieve the data, keep relevant columns and change it in to a long format. A new column is added for regions. Finally join the data to the indicator meta-data downloaded earlier. This includes official descriptions of each indicator.
## Extract data ----
WB_data <- wbstats::wb_data(
    indicator = INDICATORS,
    country = ALL_REGIONS,
    start_date = START_YEAR,
    end_date = END_YEAR
) %>%
    select(-iso2c) %>%
    rename(year = date) %>%

    ## create a column to hold the region name
    mutate(region = case_when(iso3c %in% SADC ~ "SADC",
                              iso3c %in% EAC ~ "EAC",
                              iso3c %in% ECOWAS ~ "ECOWAS")) %>%
    select(iso3c, country, region, year, everything())

## Convert to a long format ----
WB_data_long <- WB_data %>%
    pivot_longer(!c(country, year, iso3c, region),
                 names_to = "indicator_id",
                 values_to = "value") %>%

    ## Join the meta-data from earlier
    left_join(indicators_metadata, by = "indicator_id") %>%
    drop_na()
Finally time to print to a CSV.
write_excel_csv(WB_data_long, "WB_data_long.csv")
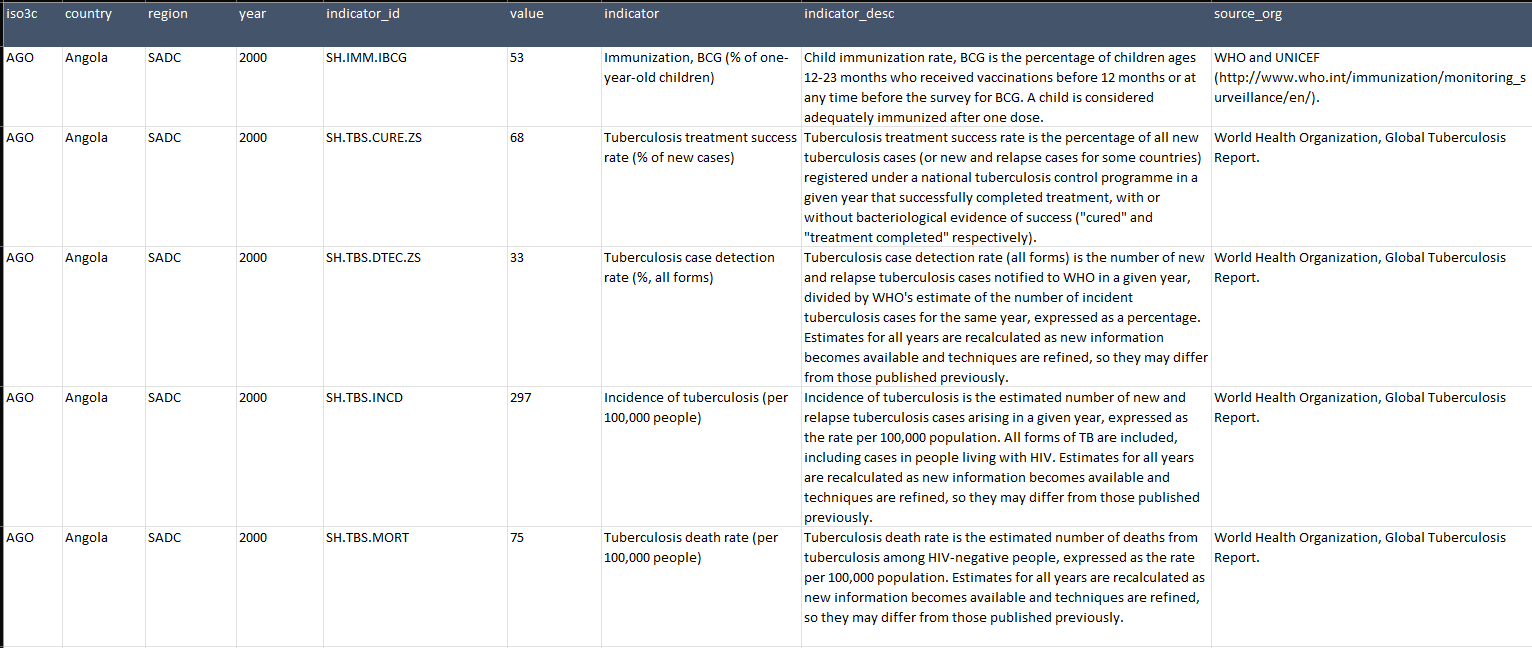
Once downloaded, the CSV file looks like this (1 row per country, per year per indicator):

All code can be found on the project Armchair TB in GitHub.
Article published on Medium