Connect to Global Health Observatory (WHO) Data API with R
The World Health Organisation Global Health Observatory (WHO GHO) provides access to open and free global development data that is collected by WHO. As of March 2023, there are 2301 indicators available for 245 regions/countries with data going back decades.
Thanks to the WHO GHO API it it easy to access this large dataset by using then httr and jsonlite packages in R. This article walks through how the Armchair TB project downloads all Tuberculosis (TB) related indicators in the WHO API dataset.
Libraries
First, let’s install the different packages from CRAN:
install.packages("tidyverse")
install.packages("jsonlite")
install.packages("httr")
install.packages("glue")
Next load the libraries. The goal is to extract the data needed for further analysis in Tableau.
library(glue)
library(httr)
library(jsonlite)
library(tidyverse)
Global Variables
Create global variables. This involves setting the URL, countries of interest, and indicators. The Armchair TB project is interested in all TB indicators from the SADC, EAC and ECOWAS regions in Africa. If it’s not known which indicators are available, or the country codes, use the code in the exploring section.
## Global Variables ----

URL_BASE <-  "https://ghoapi.azureedge.net/api/"

SADC <- c("AGO", "NAM", "ZAF", "LSO", "SWZ",
"BWA", "ZWE", "ZMB", "MOZ", "MWI",
"MDG", "COM", "SYC", "MUS")

EAC <- c("BDI", "KEN", "RWA", "SSD", "TZA", "UGA", "COD")

ECOWAS  <- c("BEN", "BFA", "CPV", "CIV", "GMB", "GHA", "GIN",
"GNB", "LBR", "MLI", "NER", "NGA", "SEN", "SLE", "TGO")

COUNTRY <- c(SADC, EAC, ECOWAS)
INDICATOR_TEXT <- "tuberculosis"
INDICATOR_TEXT_TB <- "tb"
INDICATOR <- "TB_"
Function to Convert URL to a Tibble
The function below is used to convert a URL to a tibble. Overall, this code takes a JSON file from a URL and converts it into a tidy tibble format for easier manipulation and analysis
convert_JSON_to_tbl <- function(url){
  data <- GET(url)
  data_df <- fromJSON(content(data, as = "text", encoding = "utf-8"))
  data_tbl <-  map_if(data_df, is.data.frame, list) %>%
    as_tibble %>%
    unnest(cols = c(value)) %>%
    select(-'@odata.context')
  }
Exploring the Data
The all_dimension tibble shows all data that is possible from the API. The all_countries and all_indicators shows details for countries and indicators. This can be used to define which countries and indicators should be pulled from the dataset.
# Find what you need

all_dimension <-  convert_JSON_to_tbl("https://ghoapi.azureedge.net/api/Dimension")
all_countries <-  convert_JSON_to_tbl(glue(URL_BASE,"Dimension/COUNTRY/DimensionValues")) %>%
  select(Code, Title)
all_indicators <-  convert_JSON_to_tbl(glue(URL_BASE,"Indicator")) %>%
  select(-Language)
Create a Vector of All Indicators of Interest
In the case of indicators that have TB or Tuberculosis in the title different strategies are needed. For most, using INDICATOR returns most, but there are a few cases INDICATOR_TEXT and INDICATOR_TEXT_TB are needed. The code below finds all cases where TB or Tuberculosis are mentioned, and combines then in to a vector and keeps the indicator code.
#Select a few based on globals

indicators_from_code <- all_indicators %>%
  filter(grepl(INDICATOR, IndicatorCode, ignore.case = TRUE))

indicators_from_text <- all_indicators %>%
  filter(grepl(INDICATOR_TEXT, IndicatorName, ignore.case = TRUE))

indicators_from_text_tb <- all_indicators %>%
  filter(grepl(INDICATOR_TEXT_TB, IndicatorName, ignore.case = TRUE))

indicators <- indicators_from_code %>%
  union(indicators_from_text) %>%
  union(indicators_from_text_tb)

indicator_codes <- indicators %>%
  pull(IndicatorCode)
Pull data and Convert to a List
For the project we have chosen to extract all data and then process the data using dplyr. However, it is also possible to add a query and only extract data of interest.
Each indicator has its own table in the WHO GHO, but in this case, we would like to have all data in one dataset. The code section below loops through all indicators related to TB, combines the data and outputs a list where the value column has all data for an indicator.
indicator_data <- map(indicator_codes, function(id) {
  response <- GET(
    glue(URL_BASE, id))
    content(response, "text")
})
The next code section converts the list to a tibble with one column per field.
indicator_data_tbl <- map_dfr(indicator_data, ~ fromJSON(.x,simplifyVector = TRUE)%>%
  as_tibble() %>%
  unnest(cols = everything()))
Process Data and Save as a CSV
The data is processed using the dplyr package in Tidyverse. First only relevant countries and columns are kept. The additional data from Indicators and Countries are added, columns are renamed, and columns are reordered.
all_data <- indicator_data_tbl %>%
      filter(SpatialDim %in% COUNTRY) %>%
      select(IndicatorCode, TimeDim, SpatialDim, NumericValue, High, Low) %>%

      mutate(region = case_when(iso3c %in% SADC ~ "SADC",
                                iso3c %in% EAC ~ "EAC",
                                iso3c %in% ECOWAS ~ "ECOWAS")) %>%

      rename(Code = SpatialDim,) %>%
      left_join(indicators, by = "IndicatorCode") %>%
      left_join(all_countries, by = "Code") %>%

      rename( year = TimeDim,
              value = NumericValue,
              high_value = High,
              low_value = Low,
              country_code = Code,
              indicator_name = IndicatorName,
              country = Title,
              indicator_code = IndicatorCode) %>%
      select(indicator_code, indicator_name, year, country_code, country, everything())
Finally time to print to a CSV.
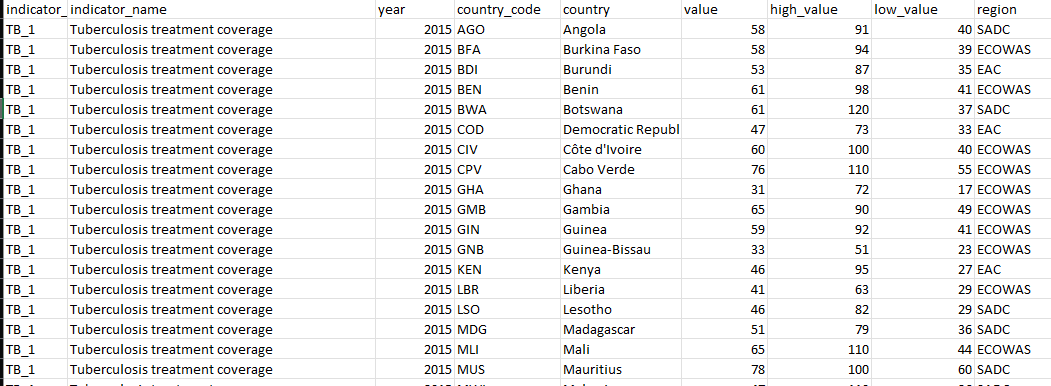
write_excel_csv(all_data,"WHO Data.csv")Once downloaded, the CSV file looks like this (1 row per country, per year per indicator):

All code can be found on the project Armchair TB in GitHub.
Article published on Medium