Replicating the HIV Sub-National Estimates Viewer in Tableau: A Step-by-Step Guide
The HIV Sub-National Estimates Viewer is a tool used to visualize and analyze estimates of HIV prevalence, incidence, and other related indicators at a sub-national level. It allows users to explore data and gain insights into the distribution of HIV across different regions within a country or territory. This viewer typically provides interactive maps, charts, and tables to present the data in a user-friendly format.
This tutorial walks through the process of recreating the HIV Sub-National Estimates Viewer using R and Tableau, with the aim of enabling individual analysis and expanding the functionalities of the viewer.
Getting started:
Shape file (e.g. Global Administrative Areas - GADM)
Dataset from HIV Sub-National Estimates Viewer (https://naomi-spectrum.unaids.org/)
Shapefile for DR Congo
The DR Congo shapefile comprises three hierarchical levels: Country, Province, and Territory/Town. The “engtype 2” field distinguishes between territories and towns. Going forward, I’ll denote territories as districts.
Download data from HIV Sub-National Estimates Viewer
Choose from the options provided below. Make sure to toggle between view types and table options as indicated.
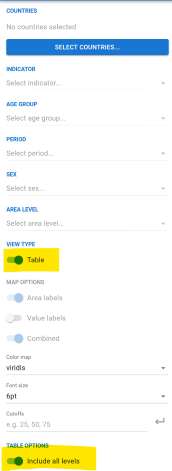
After completing all selections (and ensuring “Table” is chosen), you will observe the following. Click on the CSV icon to initiate the data download.
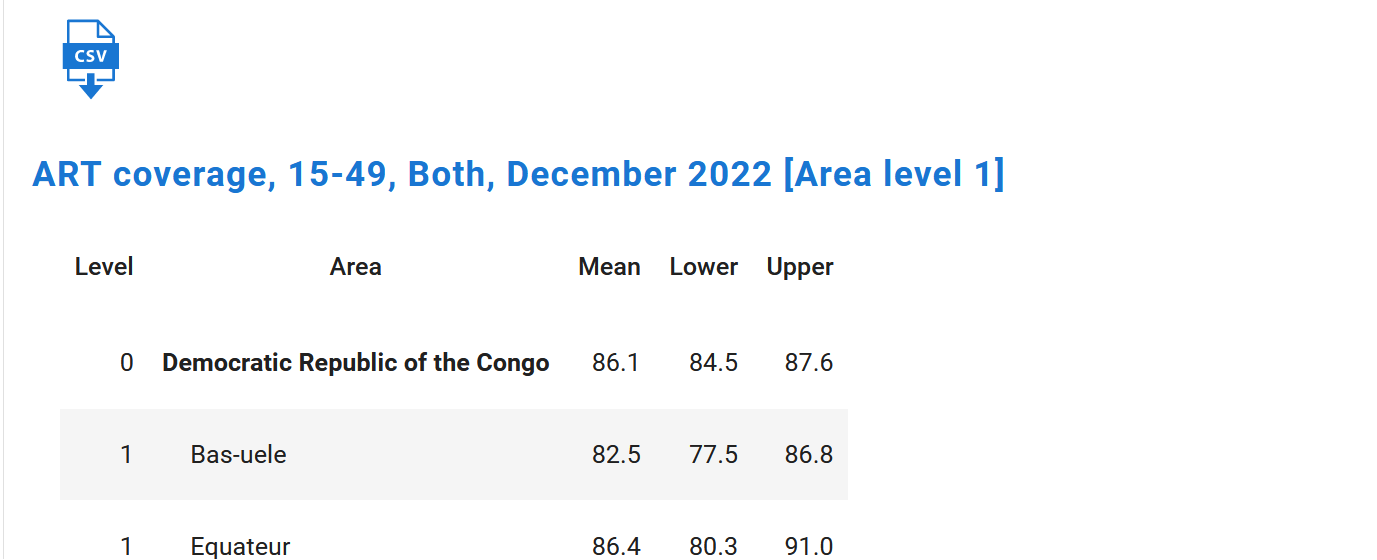
The data is presented in an organized manner by level, a crucial aspect for establishing the hierarchy. It’s important not to modify this arrangement before importing the data into R. The dataset comprises four levels, but only three will be utilized in Tableau, aligning with the three levels present in the shapefile.

Prepare Data using R
- Below is an example of importing libraries, setting paths, and creating placeholders for additional columns based on the selected data from the HIV sub-national estimates viewer
library(tidyverse)
library(zoo)

#---- GLOBAL

PATH <-  "Data/dr_congo_level3_ART_coverage_all.csv"
OUTPUT <- "Dataout/"
AGE <- "All Ages"
SEX <- "Both"
INDICATOR <- "ART Coverage"
PERIOD <- 2022- Below is a function in R that converts a list of administrations into a hierarchy. In this example, Area Level 3 is selected, and “include all levels” is chosen in the Table Option. The function uses zoo package in R.
clean_hierarchy <- function(df) {
    df %>%
        mutate(
            level_name = paste(level, area, sep = "_"),
            country = str_extract(level_name, "^0_(.*)"),
            province = str_extract(level_name, "^1_(.*)"),
            district = str_extract(level_name, "^2_(.*)"),
            sub_district = str_extract(level_name, "^3_(.*)")
        ) %>%
        mutate(
            across(country:sub_district, ~ zoo::na.locf(.x, na.rm = FALSE))
        ) %>%
        filter(!(province == level_name | district == level_name)) %>%
        mutate(
            across(country:sub_district, ~ str_replace(.x, "\\d+_",""))
        ) %>%
        drop_na()
}
Below is a function in R that can be used to create additional columns for combining datasets with different indicators, ages, or sexes. This function allows you to download separate datasets for each indicator (or age or sex) in Tableau and then combine them in R before importing them into Tableau.
add_columns <- function(df, age, sex, indicator, period){
    df %>%
        mutate(
            age = age,
            sex = sex,
            indicator = indicator,
            period = period
        )
}- Below is an example of how you can run the data through the clean_hierarchy function, create additional columns. It is important to check the names of provinces and districts against the shapefile from GADM. In this example, the district “Oïcha” is updated to “Oicha” to match the shapefile.
df <- read_csv(PATH) %>%
    clean_hierarchy %>%
    add_columns(AGE, SEX, INDICATOR, PERIOD) %>%
    #different naming of district
    mutate(district = case_when(district == "Oïcha" ~ "Oicha",
                                .default = district)) %>%
    select(country, province, district, sub_district,
           period, sex, age, indicator, lower, mean, upper)
write_csv(paste0(OUTPUT, "spectrum.csv"))- This is how the final dataset appears:

Recreating the ART Coverage map in Tableau
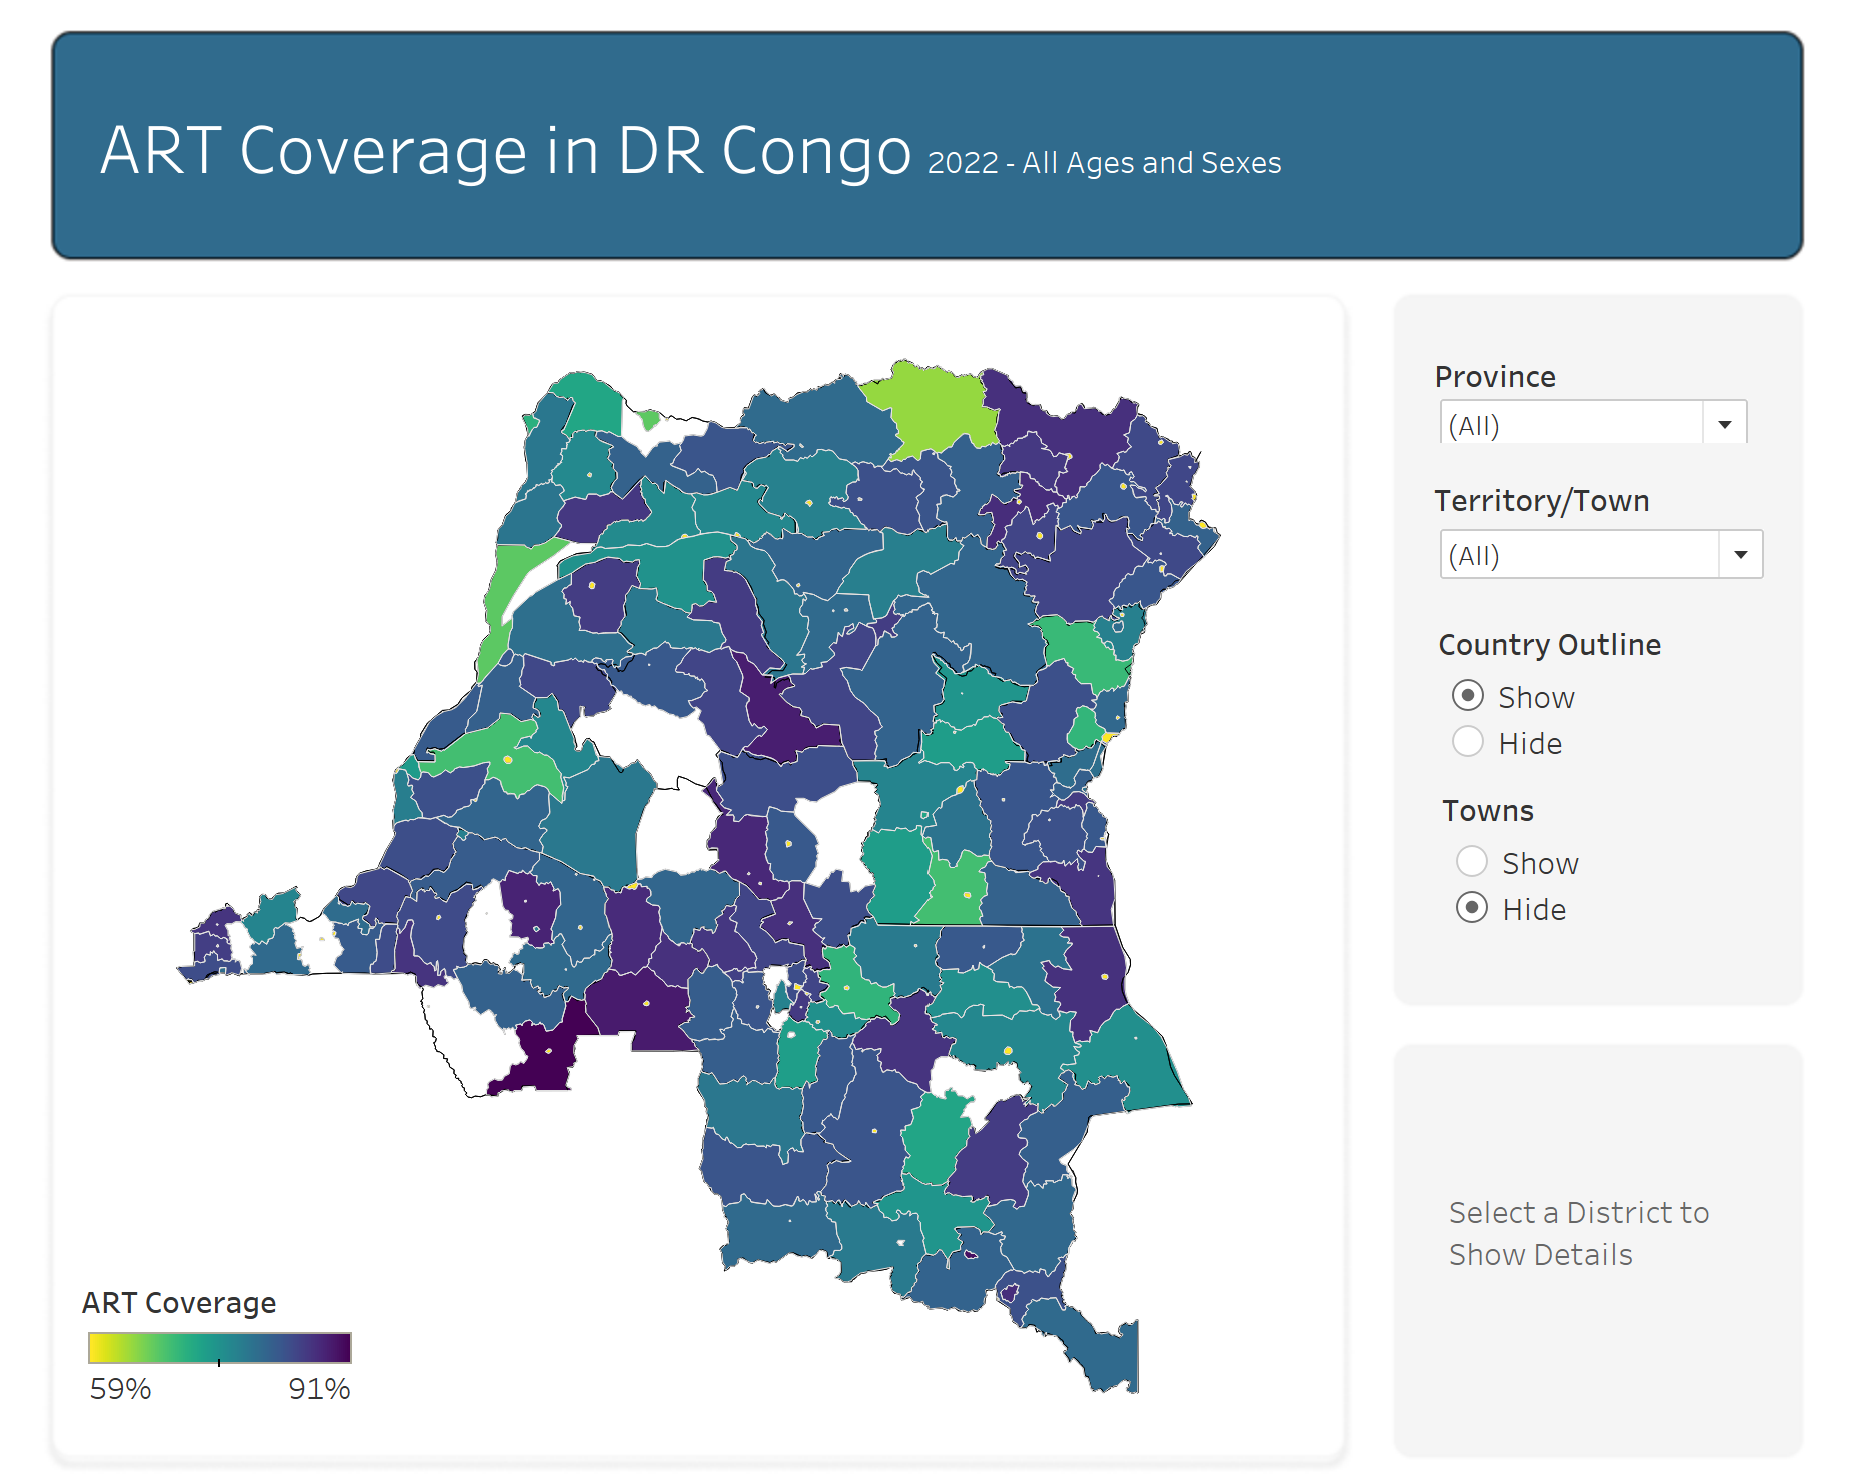
Import Data
The spatial file is provided in a zipped format. Tableau does not require it to be unzipped, but if you choose to unzip it, ensure that the “.shp” file is placed in the same folder as the other spatial files.
Note: Verify that the administration names from the HIV Sub-National Esimtates Viewer match those in the spatial file. It may be necessary to update the names in R before joining the data in Tableau.
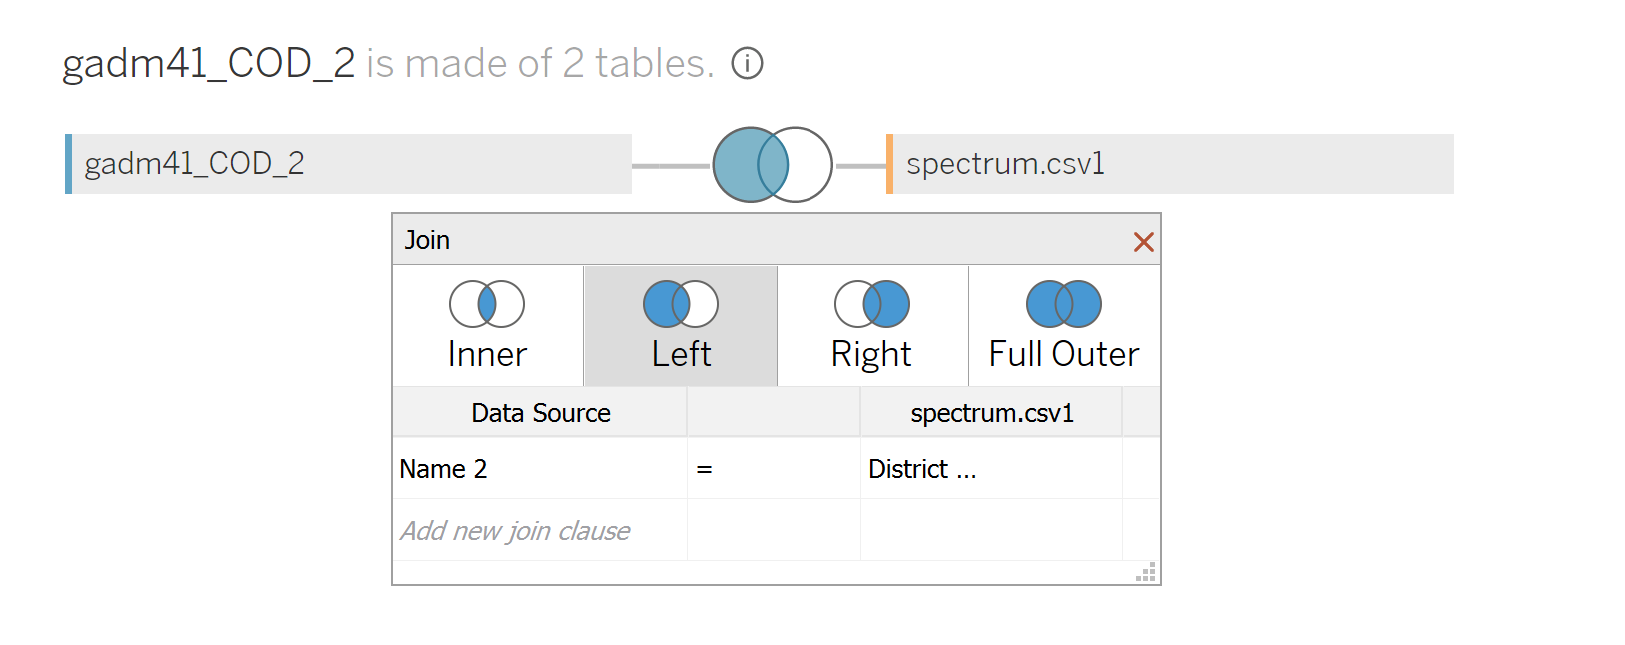
The shapefile should be joined to the estimates data using the lowest level in the dataset. In this case, “Name 2” in the shapefile corresponds to “District” in the estimates data. The join is as follows:
Create Layers
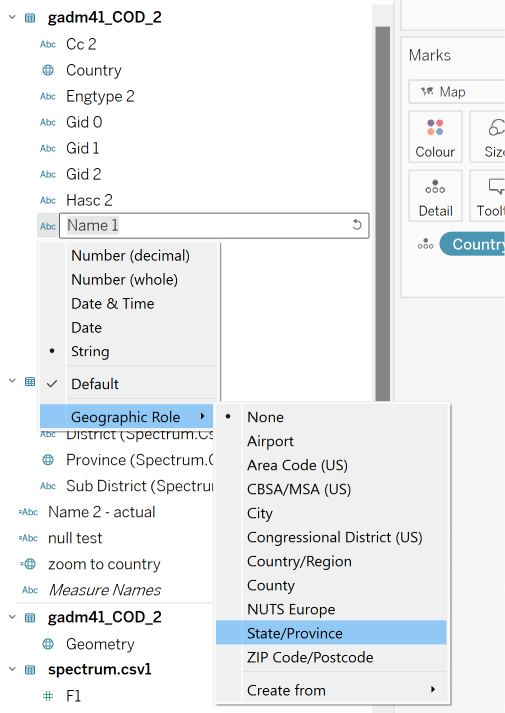
Map layers can be created in Tableau using geometry (polygons) and points. Check all geographical elements you want to use are marked as spatial in Tableau (they should have a small globe). If they don’t, change the data type to geographic.

If the data type does not correspond to a geographic role, then it should be modified.
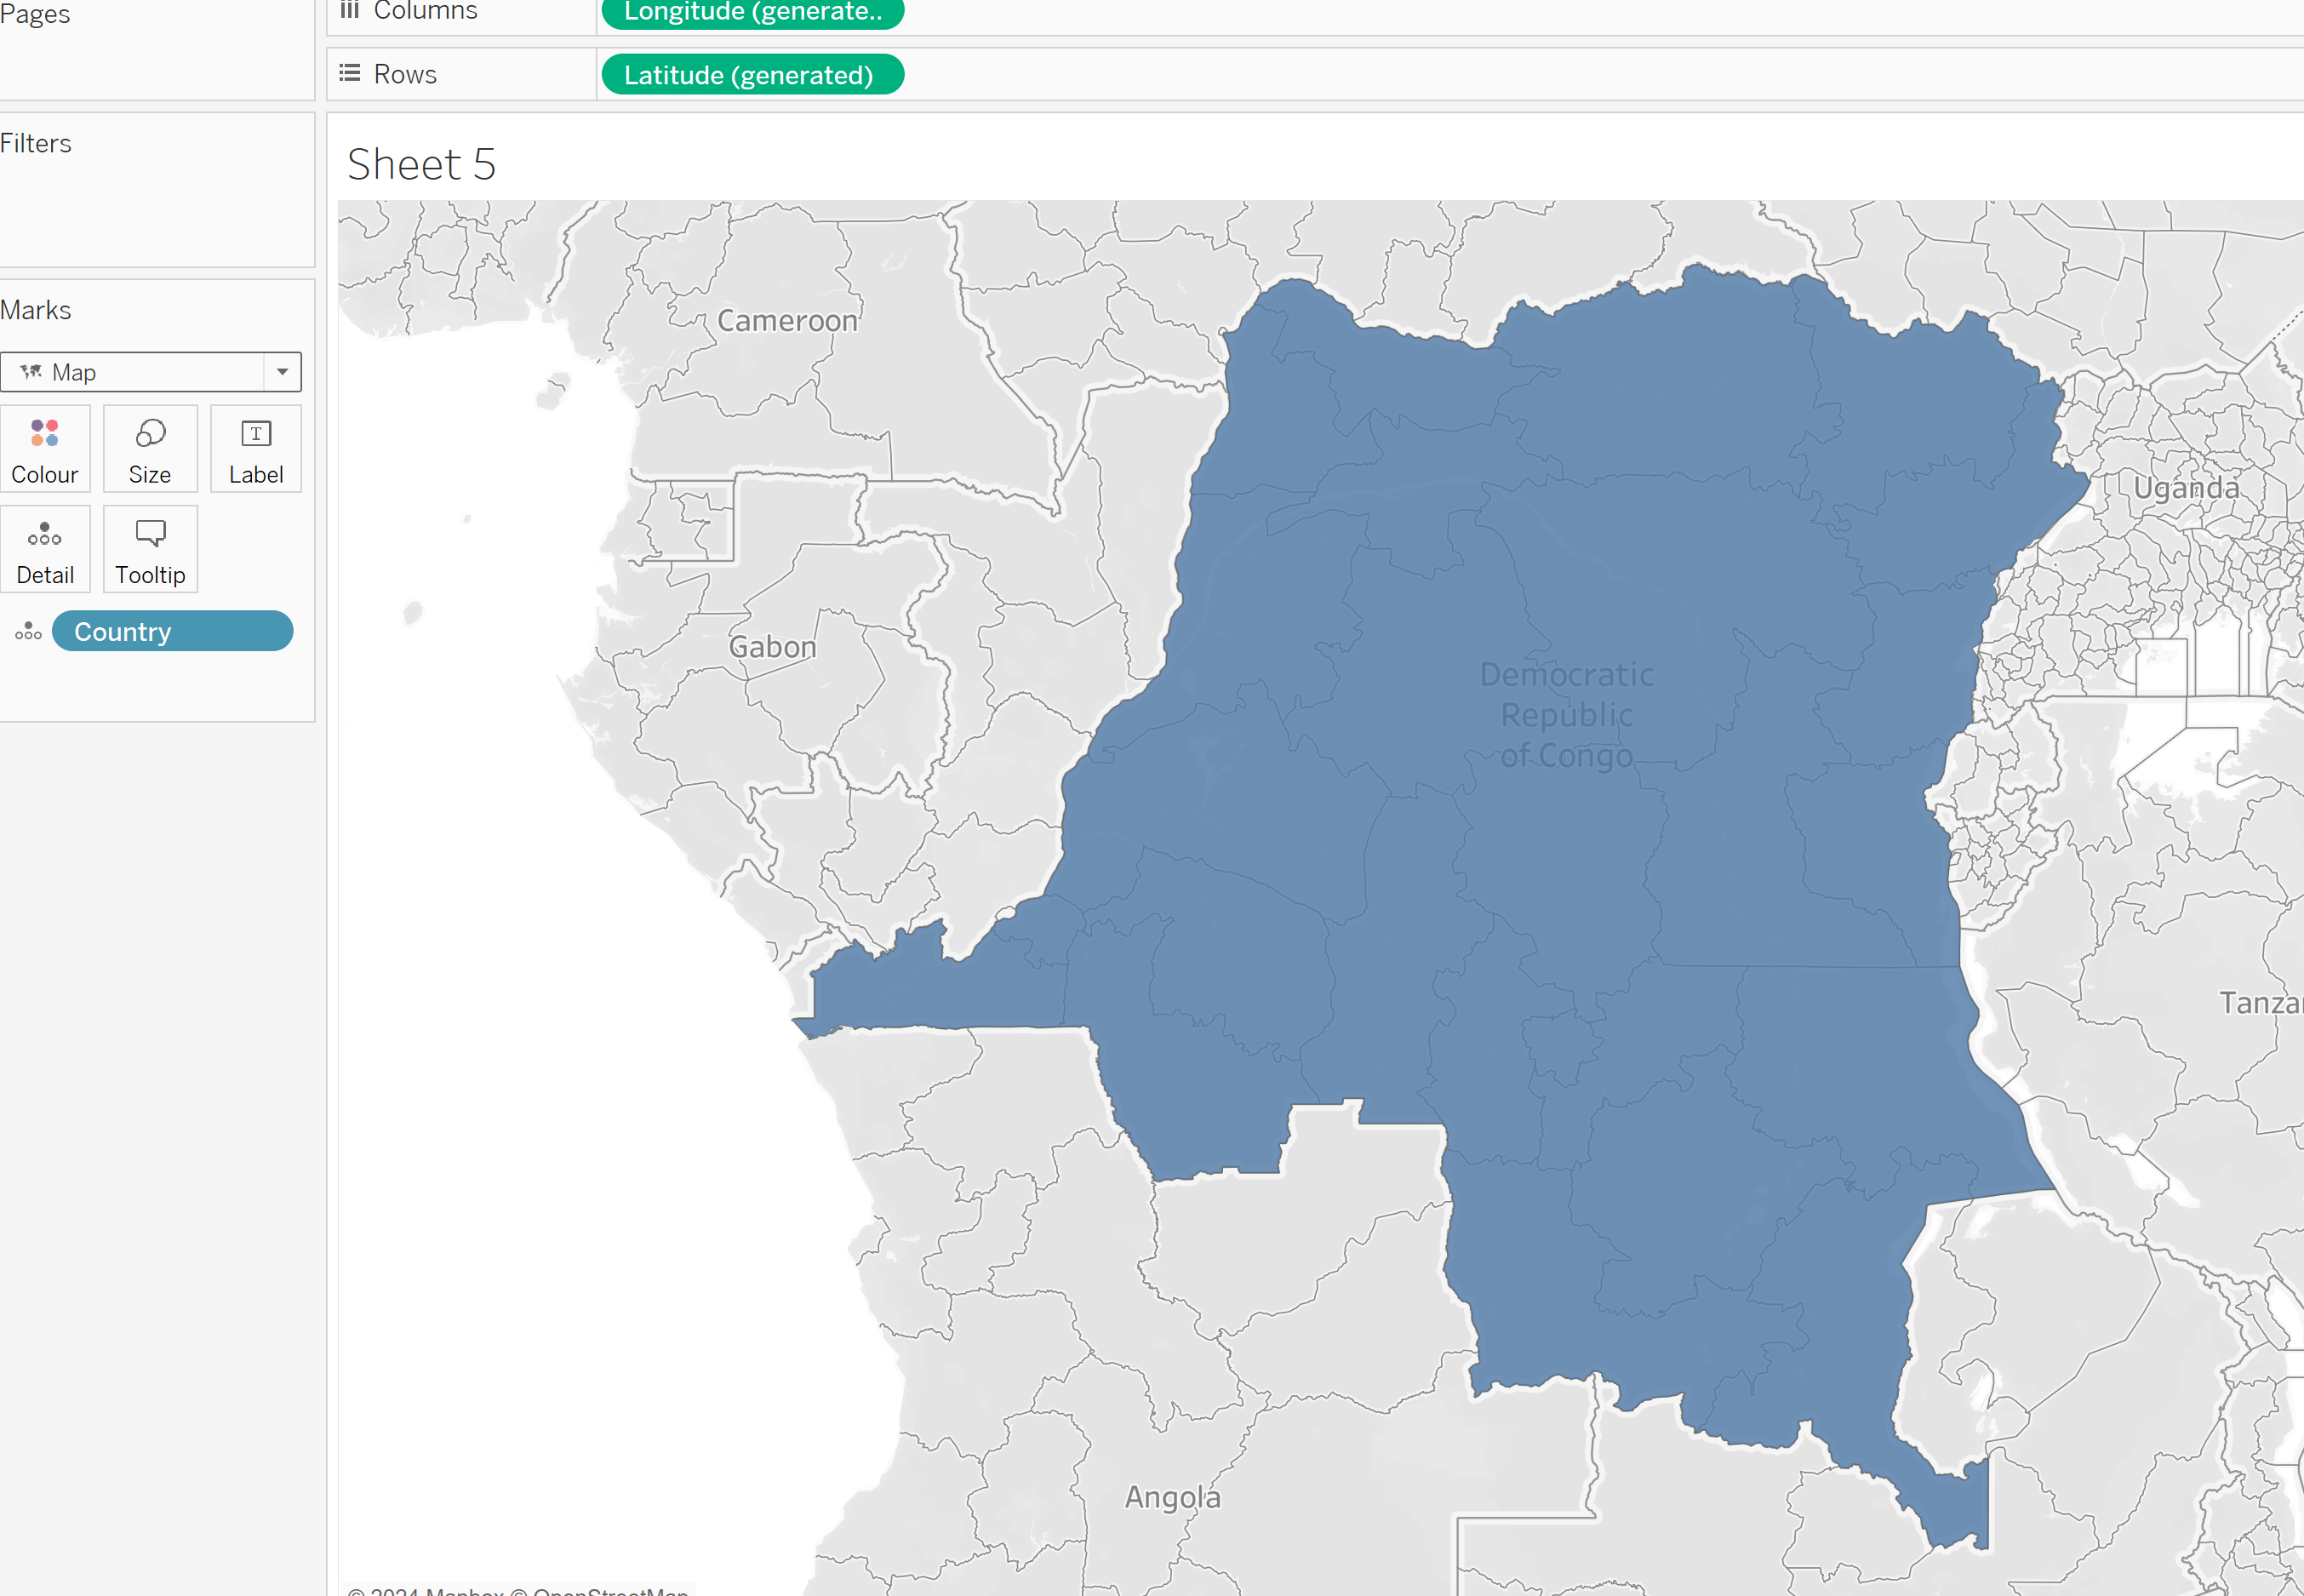
Add country (double-click). Ensure the mark type is map. Click on the Colour card and change the opacity to 0% and add a border.
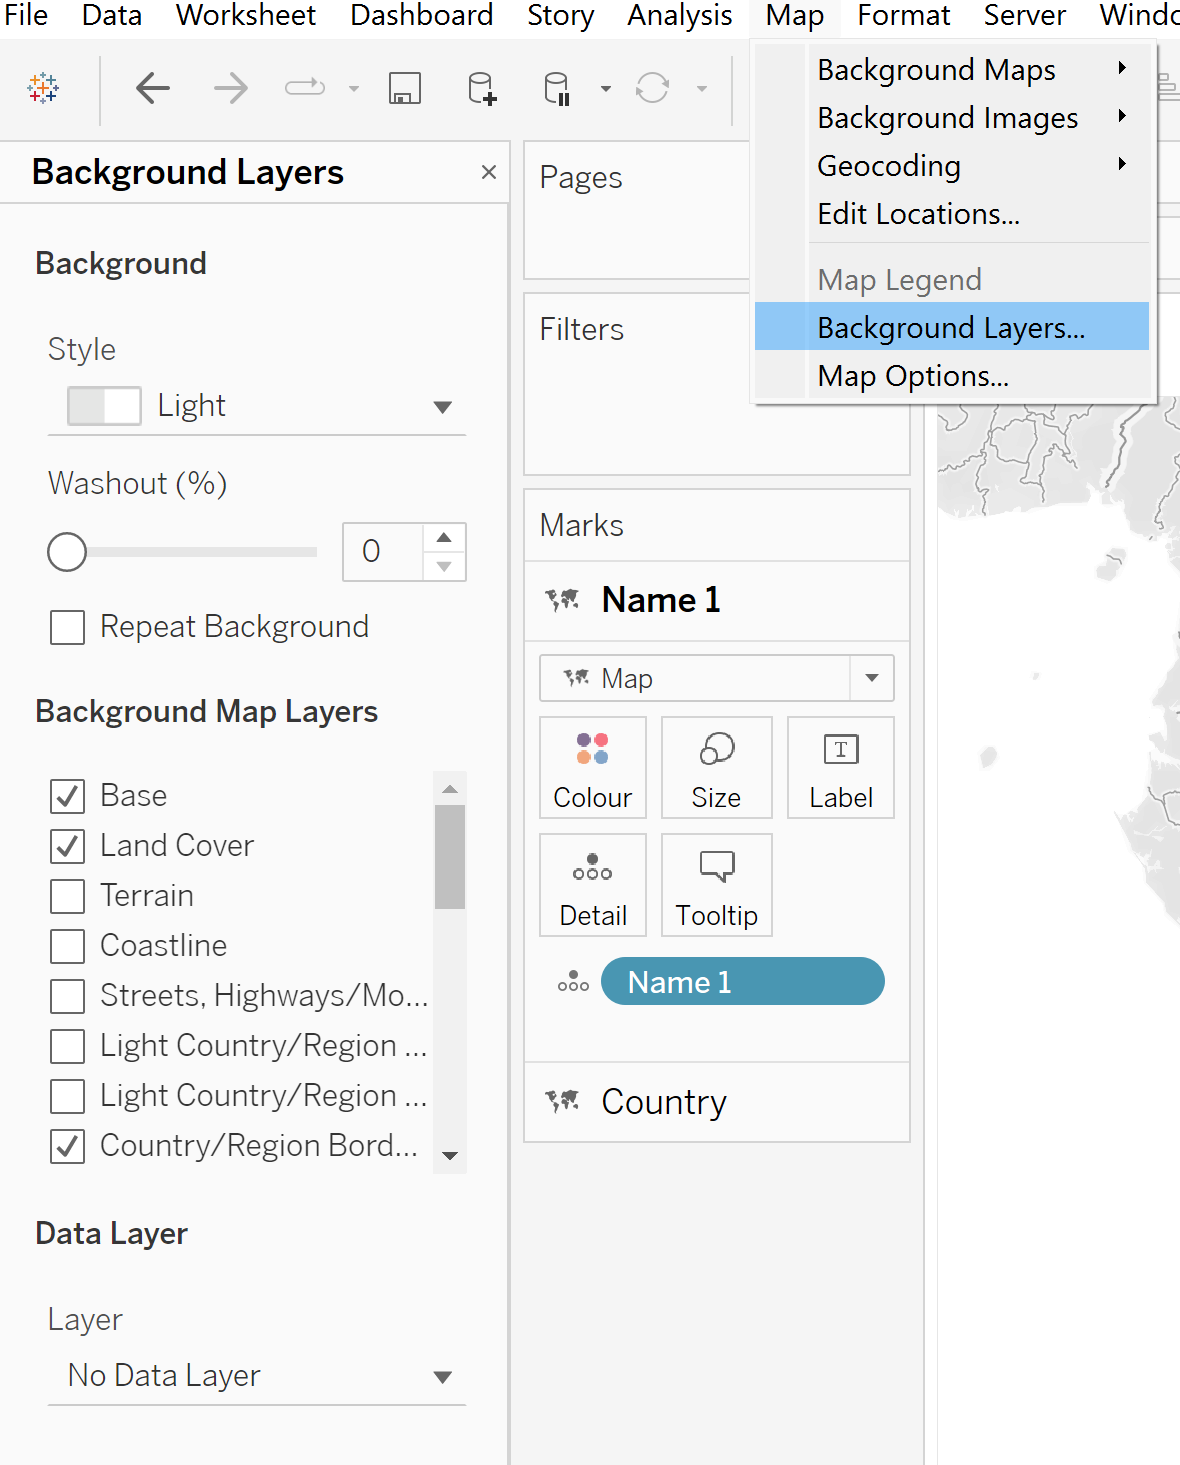
Update Background Layers and set Washout to 100%. This removes the background from the map.
Add Province
To include the province, drag it onto the canvas until “Marks Layer” is visible, then drop it. Confirm that the mark type is set to “map.”
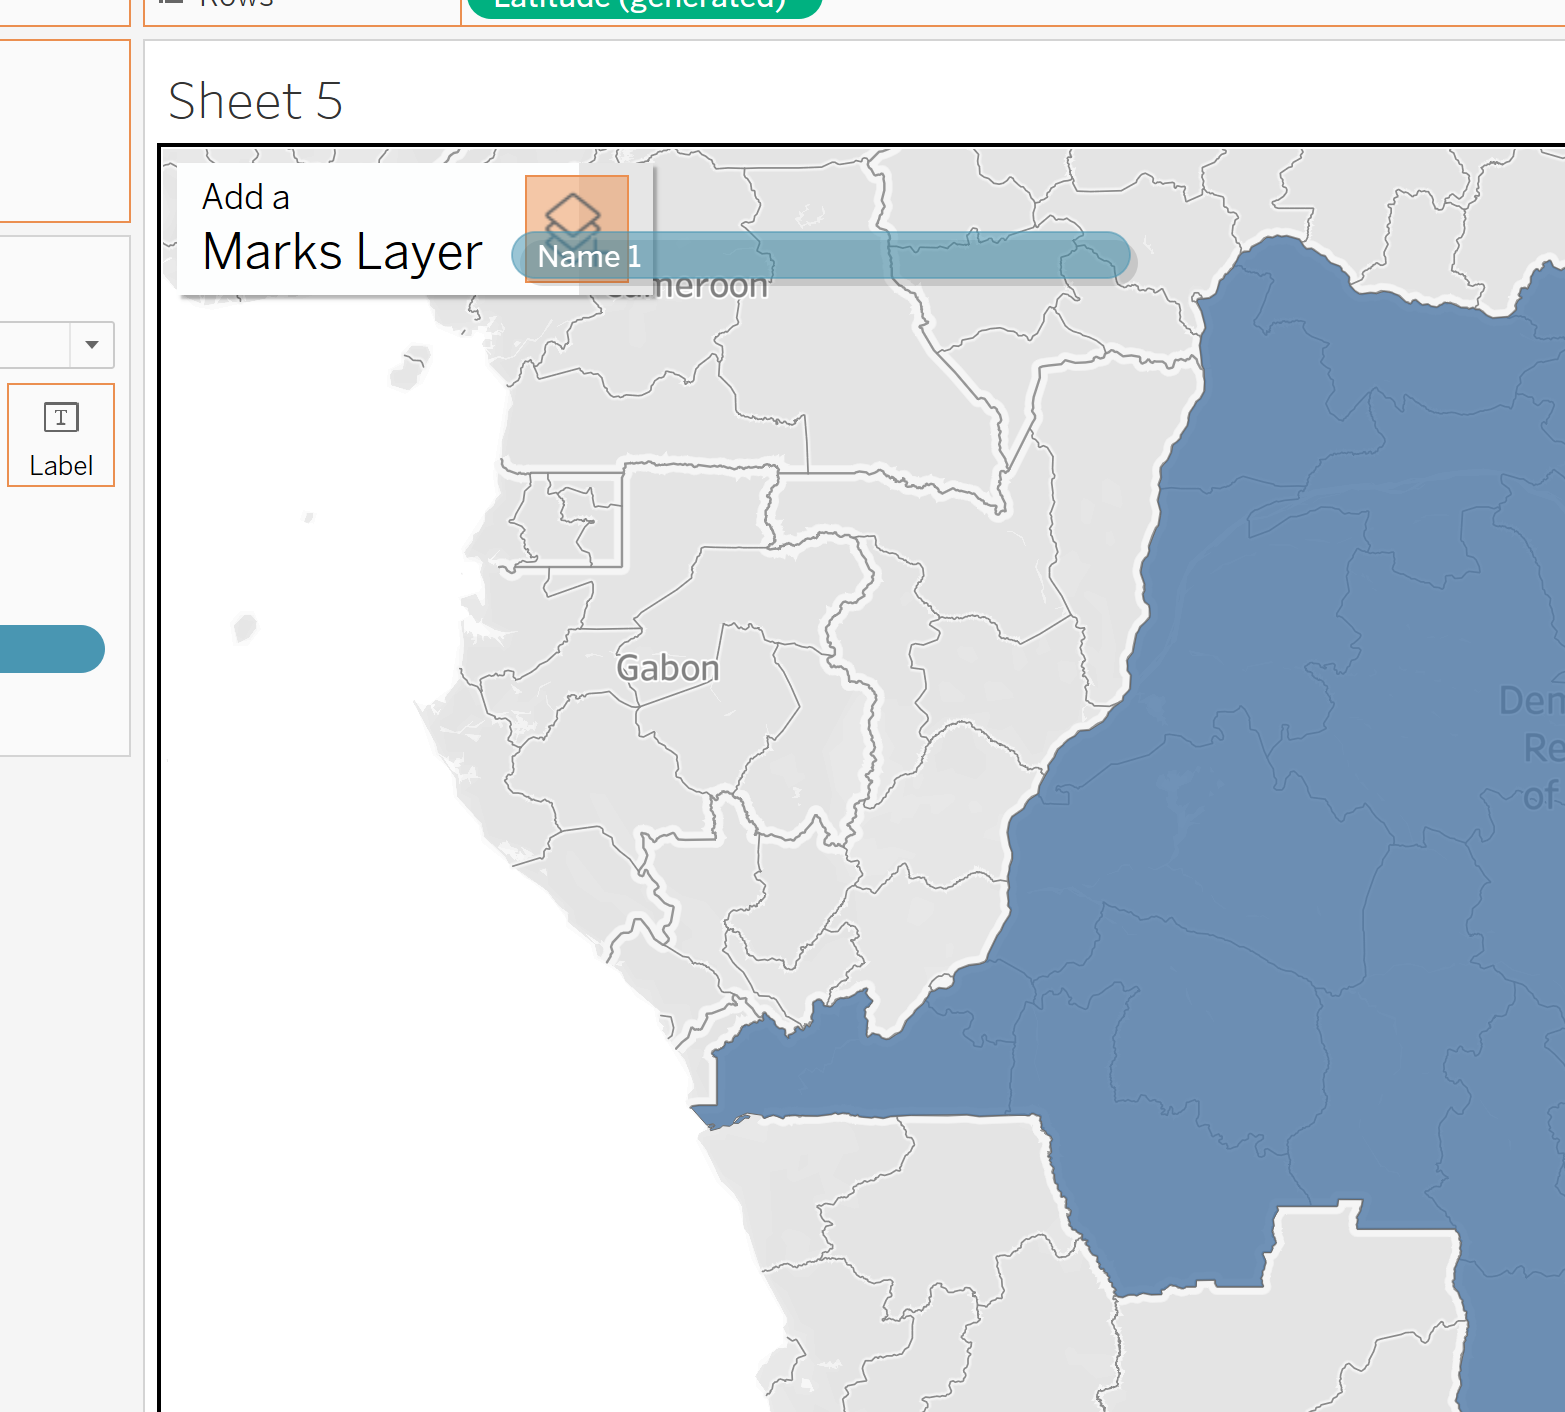
Tableau automatically interprets province and country data, eliminating the need for a shapefile. However, if you encounter the following error, it may be due to your computer settings.
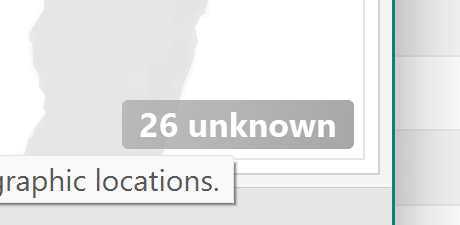
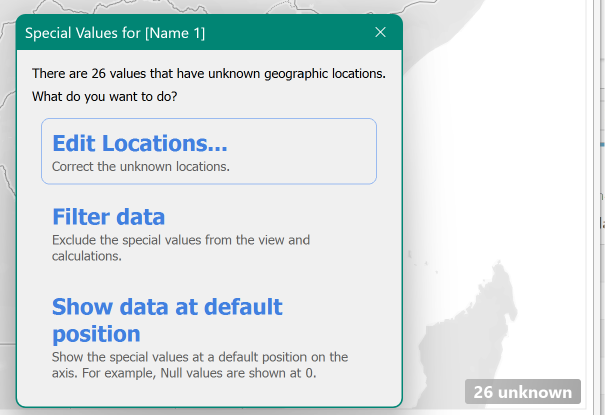
Click on “unknown” and select Edit Locations.
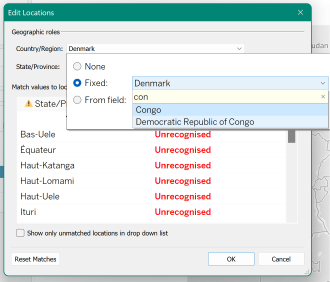
You can either specify the country directly (if it remains constant) or indicate a field containing the country information.
Add Districts
This is where the “geometry” field from the shapefile comes into play. When Geometry is dragged as a layer, it appears as COLLECT(Geometry) in the marks shelf. Follow the same process as in step 2: drag until you see “add layer”. Ensure the mark type is set to “map”. Add the district name to detail, and apply mean to color. By default, it will be summed. If the district isn’t the lowest level, use avg(mean) instead of sum(mean).
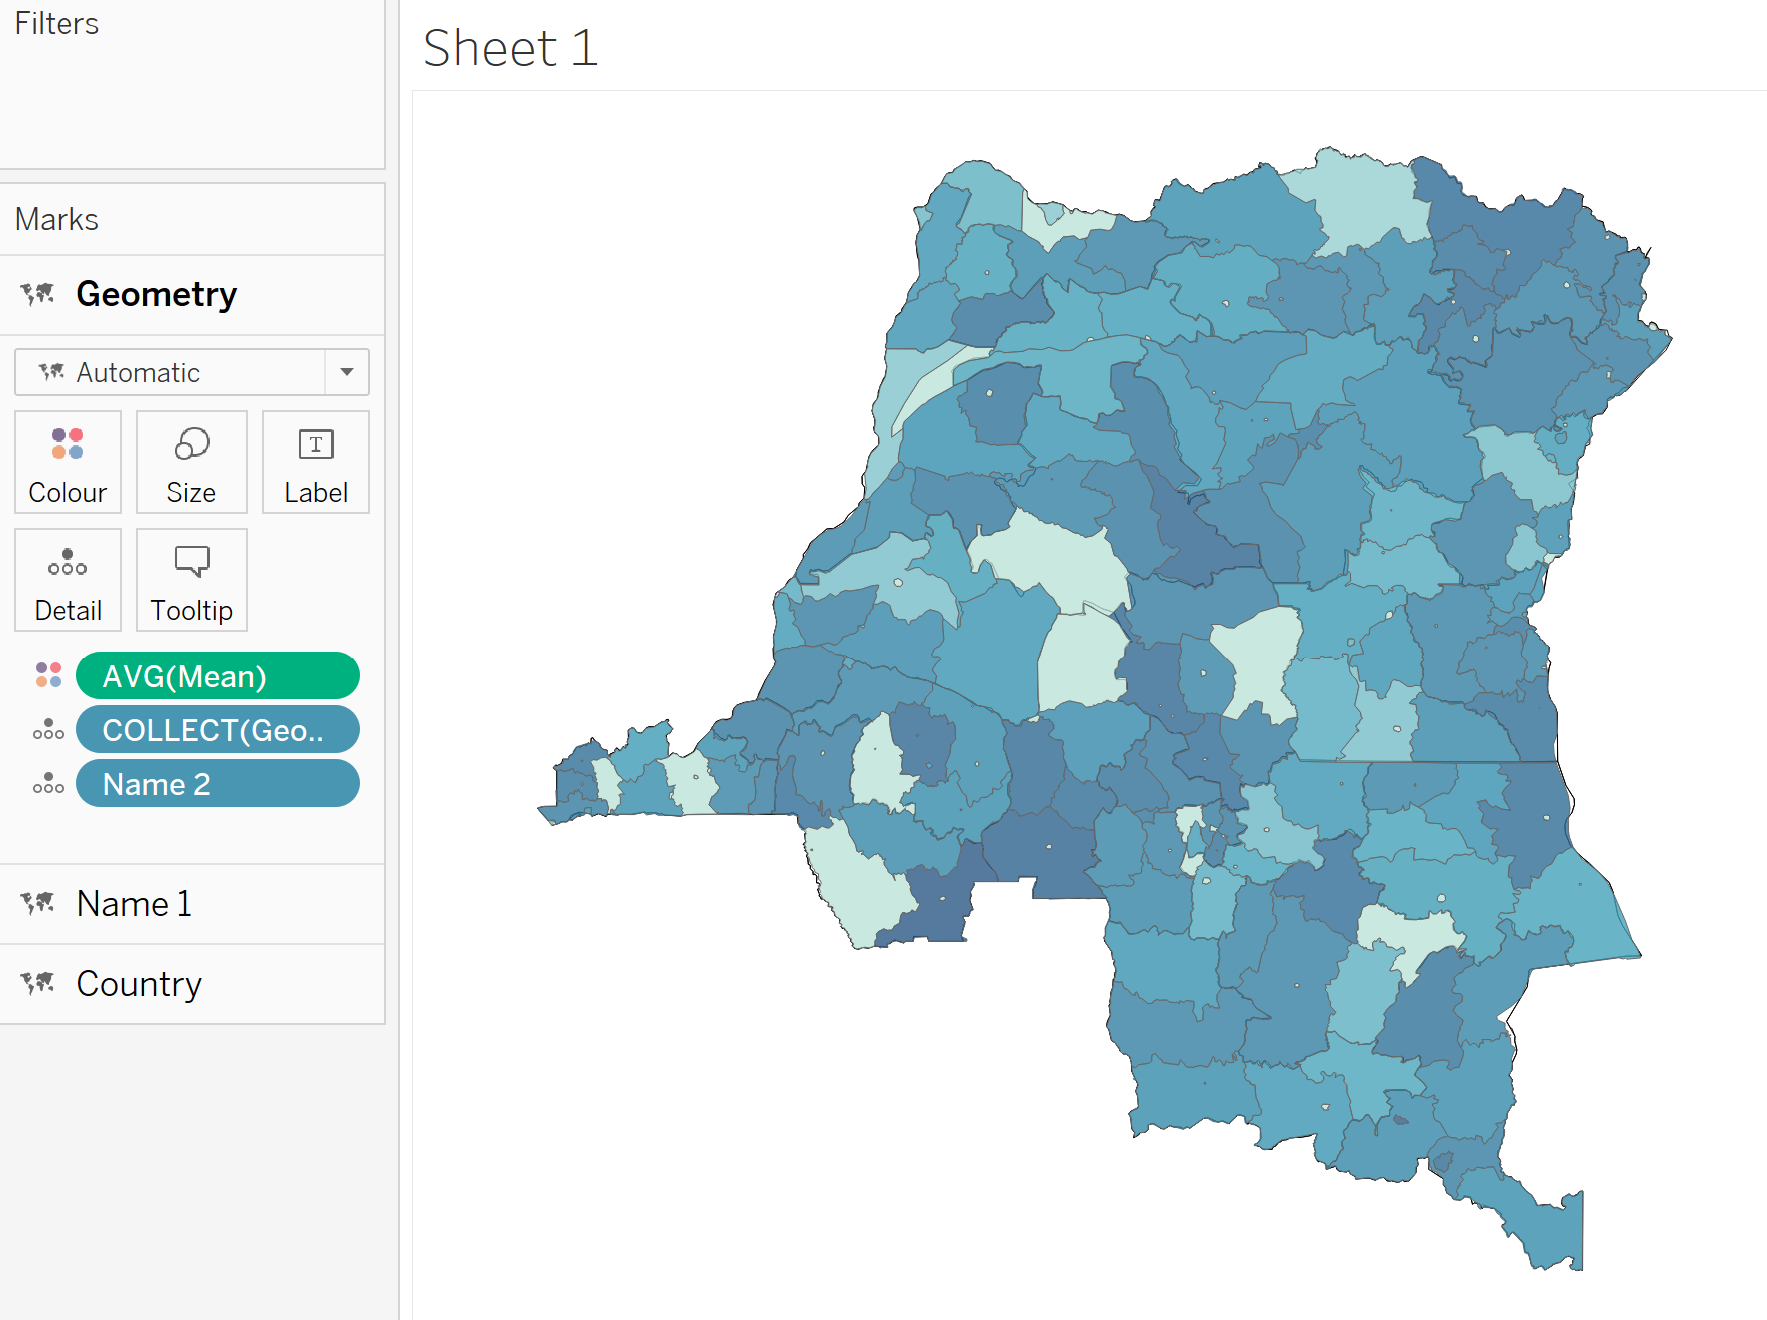
Change the legend colour to Viridis. In the map below, null values appear as yellow. We want to remove nulls but keep the data relating to towns.
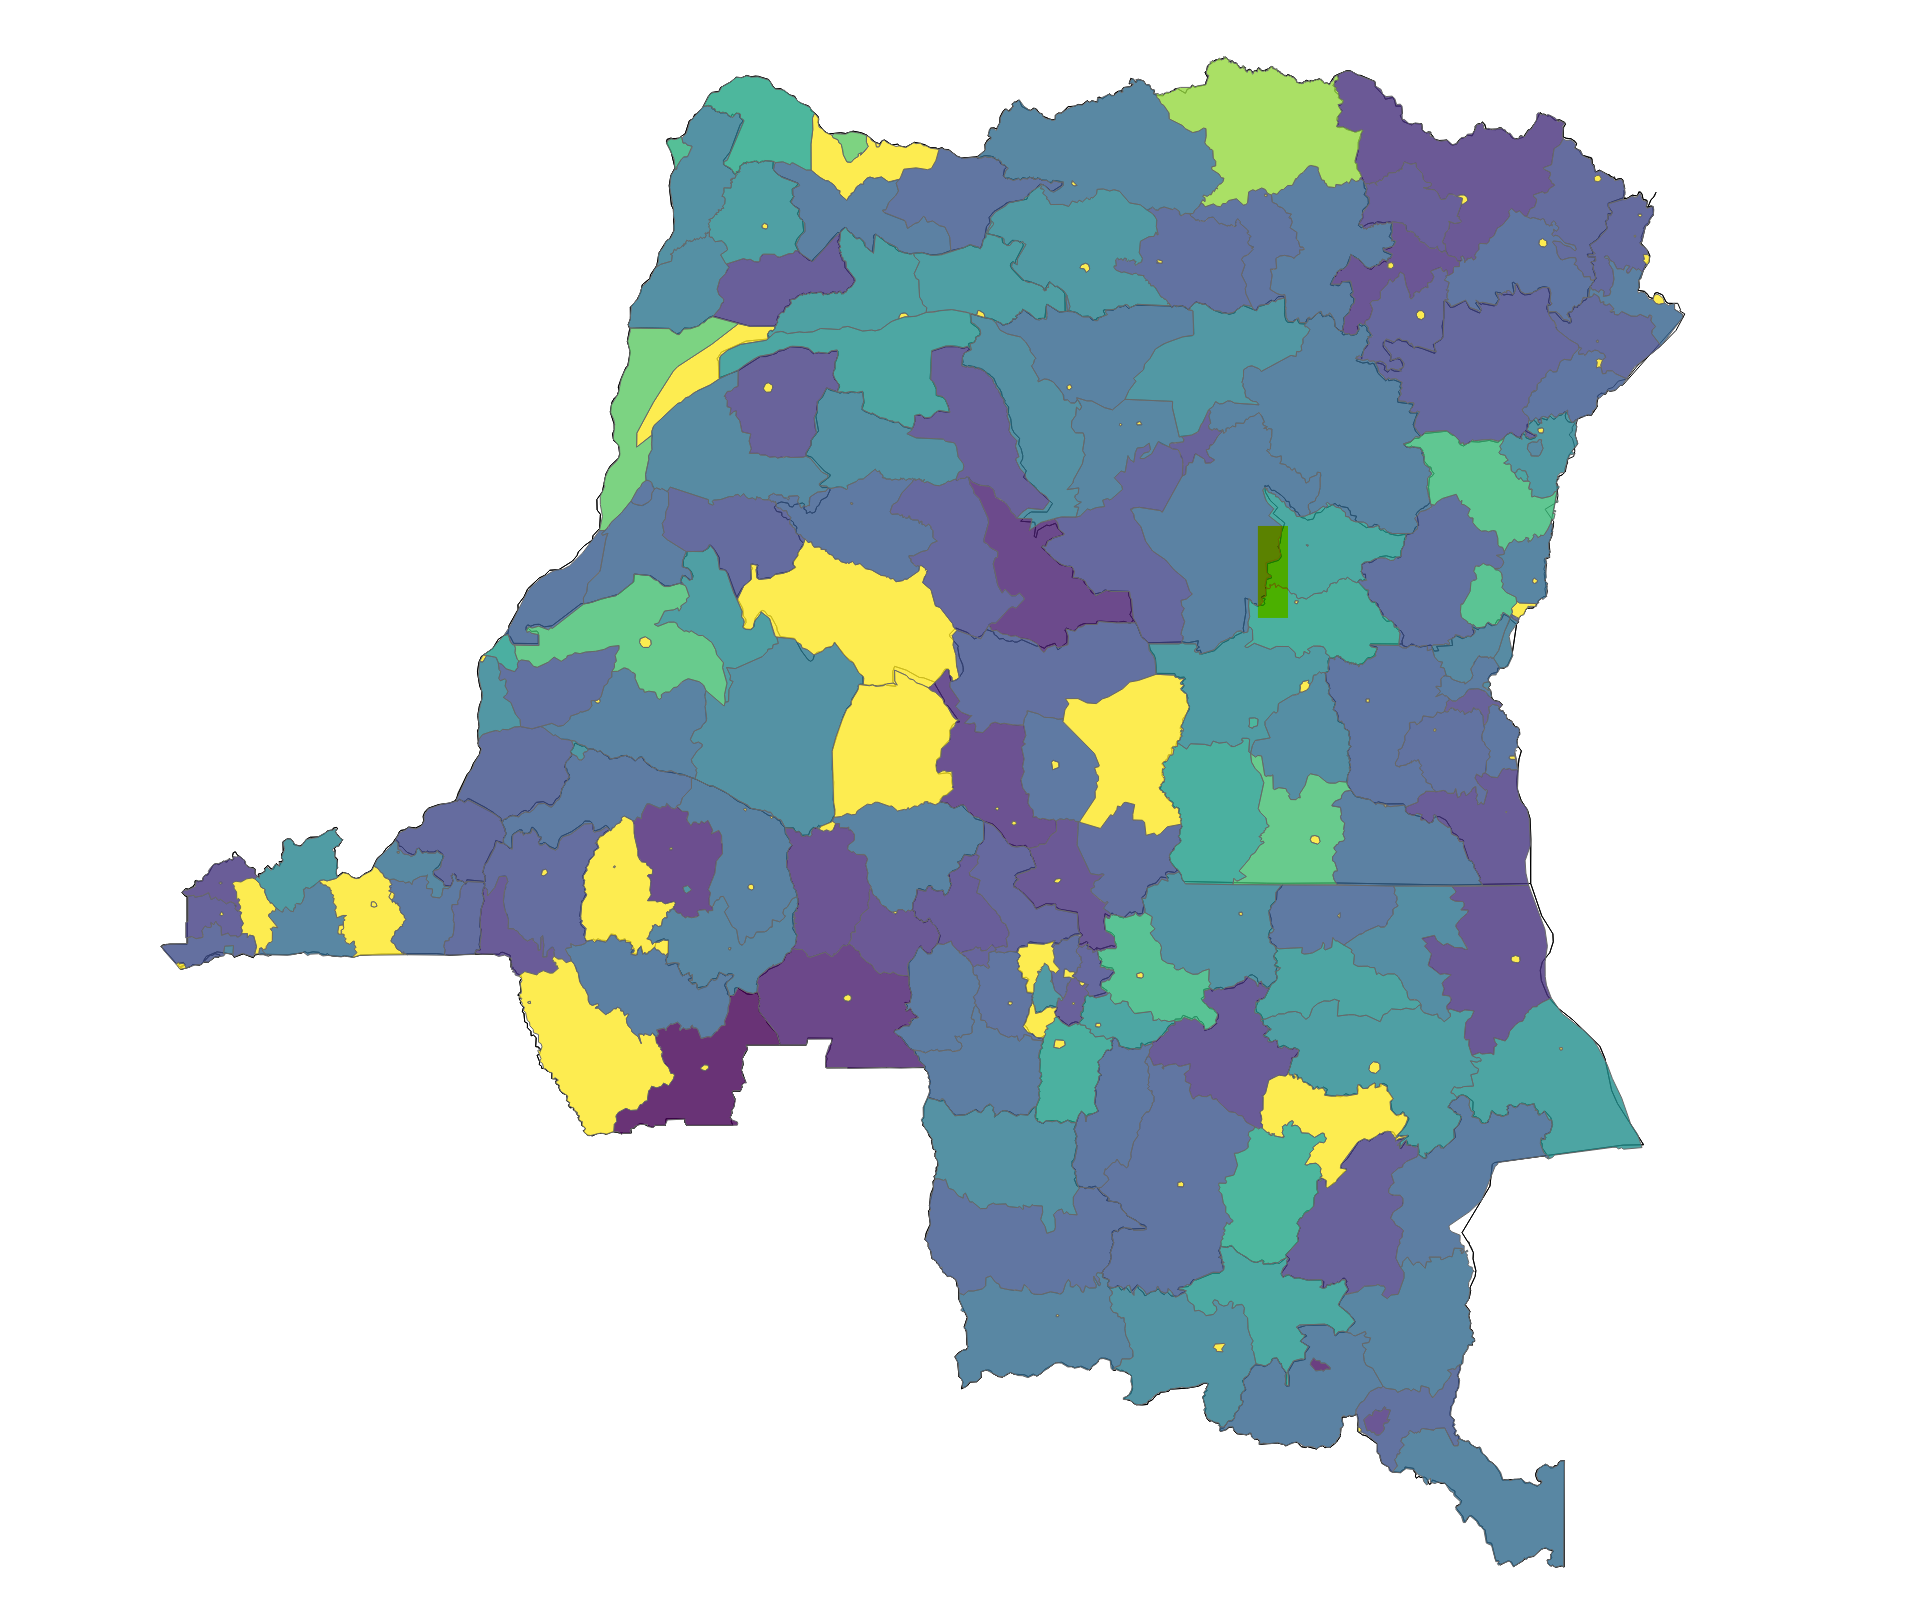
Create a calculation to display districts without a value as white. To retain the ability to display towns, create the following calculation and place it in filters.
iif([Engtype 2] = "Territory" and
isnull([Mean (Spectrum.Csv1)]), "remove", "keep")
Create a Map Layer for Towns
Create calculations for additional layers (then drag in similar to above). The Example below shows how to create a layer for towns. Set the mark type to circle, and add the calculation to text to show names.
iif([Engtype 2] = "Town", [Geometry], null)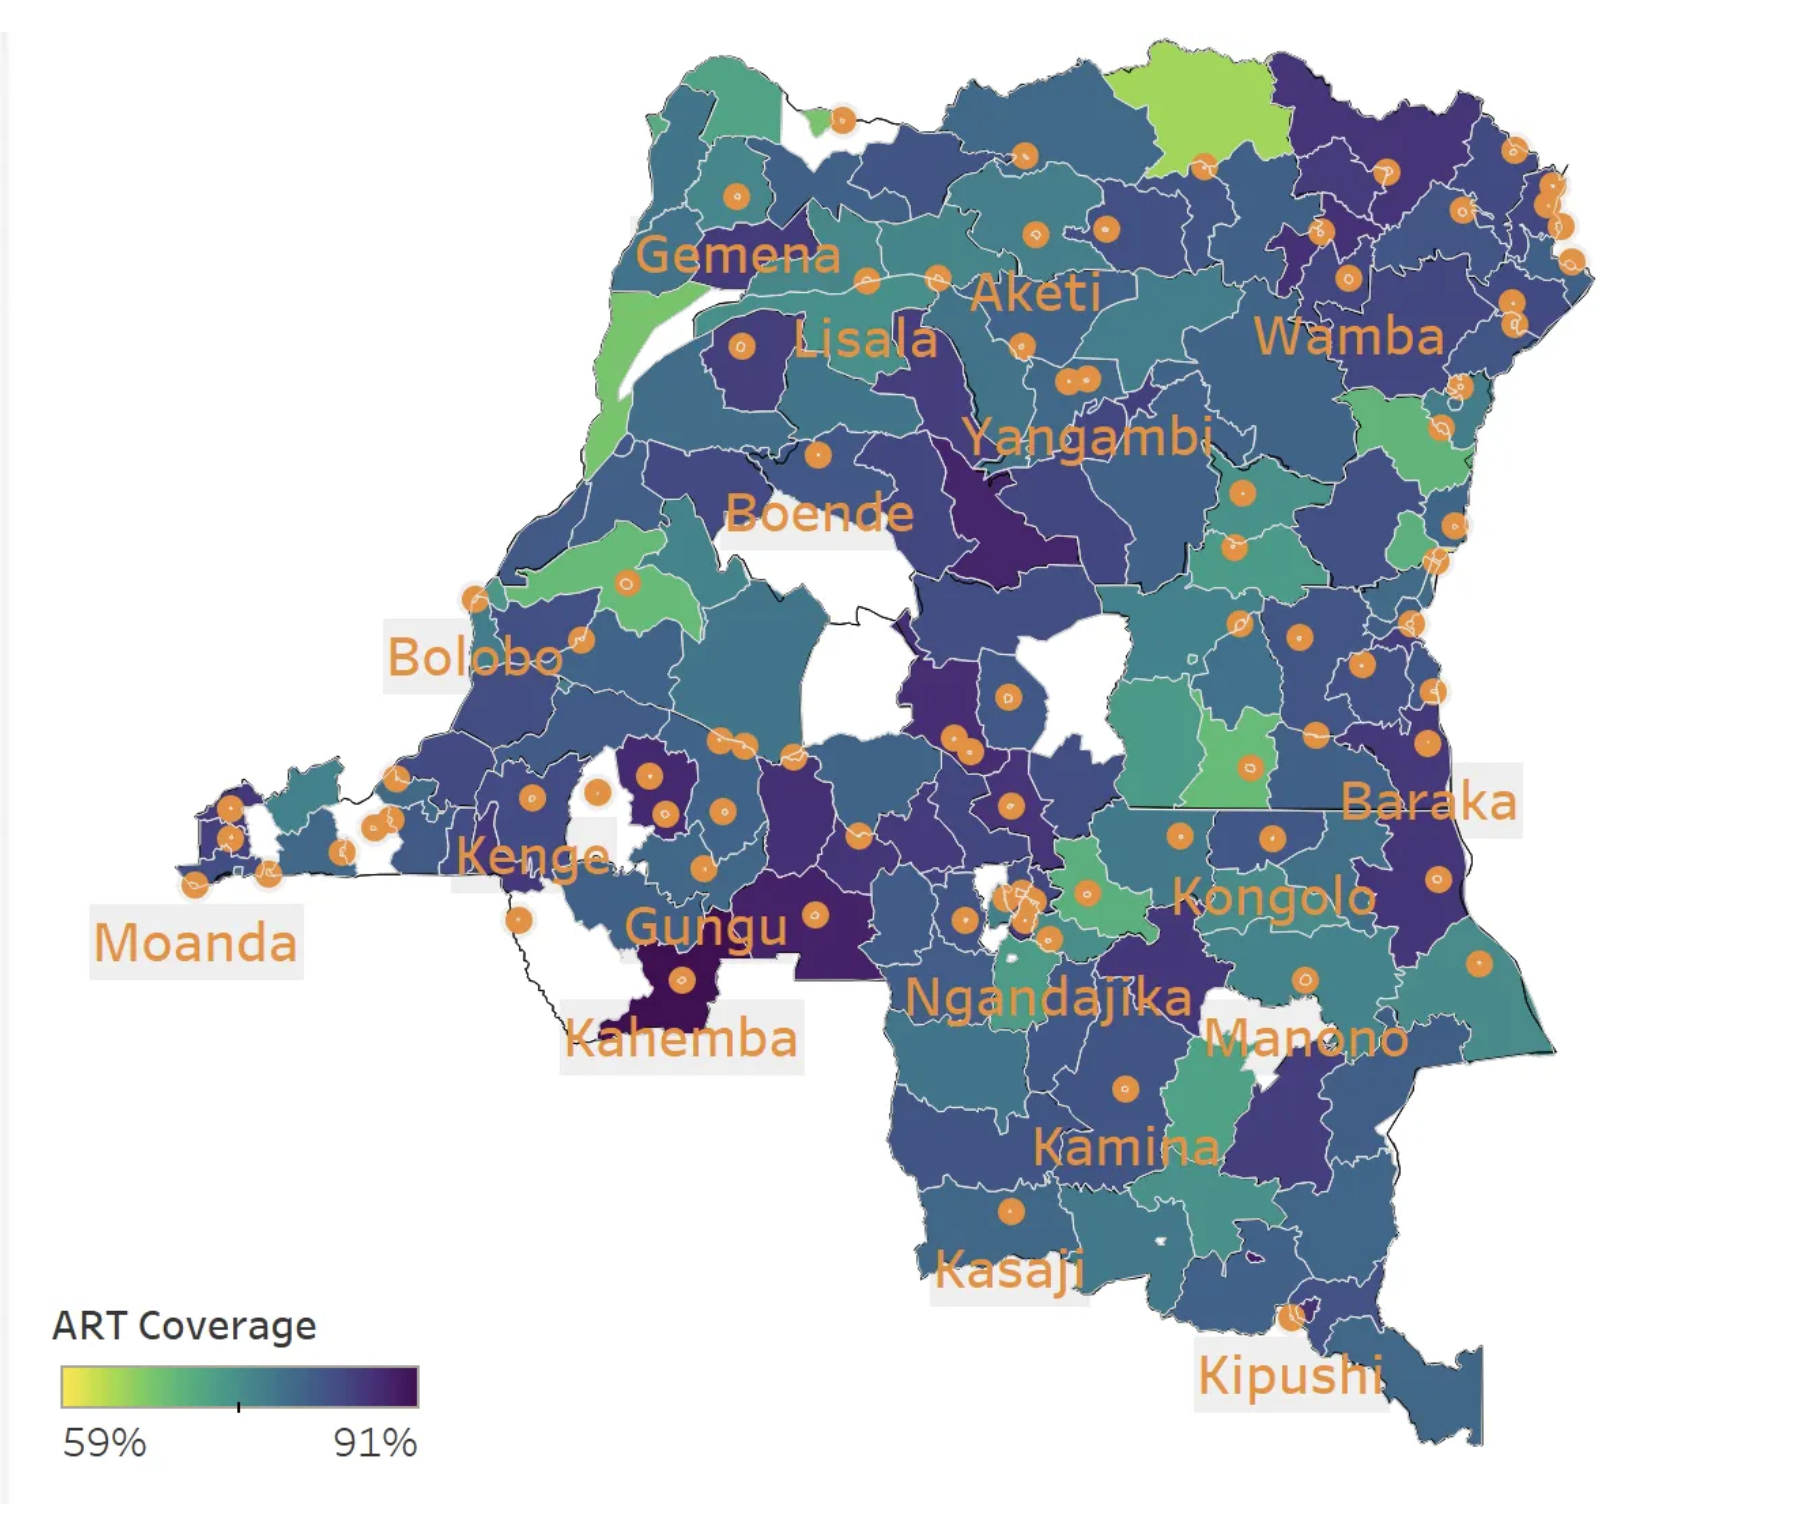
Interacting with layers using the Layer Control
The Layer control can be used to toggle layers on and off by users. It appears when you hover over the top left hand corner of the map.
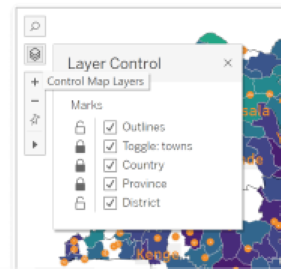
Using parameters to control layers
Create a parameter control, then use the following calculation. [toggle: towns] is the name of the parameter, and [map layer: town] is the layer created for towns. Create the map layer using the calculation below:
iif([toggle: towns] = 1, [map layer: town], null)Create the Dashboard
Drag the worksheet containing the map to the dashboard, and add any parameters and filters. The live version of this dashboard is available on Tableau Public.
Further Reading
HIV sub-national estimates viewer
Live Example on Tableau Public
Detailed explanation for creating map layers: Creating layered maps in Tableau
Live Version